SDSS Fourteenth Data Release

This post was written by Anne-Marie Weijmans, the SDSS Data Release Coordinator.


It’s the last day in July, and that means that it’s time again for a Sloan Digital Sky Survey (SDSS) data release! This year, we are very happy to announce our fourteenth public data release, DR14.

Making data publicly available is an important aspect of SDSS, as it allows SDSS data to be used world-wide by anyone with an internet connection. For more than a decade, SDSS data has been used by astronomers for their science, by teachers in their classrooms[1], by students for their school projects, and by the general public to learn more about the Universe. In order to have this broad impact, we work hard to not only make our data available, but to also ensure that it is accessible. All our data is thoroughly documented, and we have various tools, tutorials and examples to assist anyone interested in using our data — from professional astronomers to high school students. Just go to the SDSS data access website to find out how you can work with the SDSS data!

All the SDSS data are stored at the servers of the Center for High Performance Computing (CHPC), at the University of Utah. This particular server holds all the SDSS data releases, including DR14. Just DR14 alone is already a whopping 156 TeraBytes (TB = 1000 Gigabyte = 1012 bytes): that is more than 33,800 DVDs worth of data! Image credit: Adam Bolton

So, what is available in DR14?

  • APOGEE-2, or the APO Galaxy Evolution Experiment-2 is very proud to announce its first public data release! APOGEE-2 studies the structure of the Milky Way by taking infra-red spectra of stars, to learn more about how the Milky Way formed and evolved over time. You can explore these spectra using our webapp and find stellar parameters and chemical properties in the APOGEE-2 data release.
  • eBOSS, short for extended Baryon Oscillation Spectroscopic Survey, is also celebrating its first public data release! eBOSS is mapping the structure of the Universe, by taking optical spectra of distant galaxies and quasars. These spectra provide distance measurements to galaxies, quasars, and intervening gas, all of which enable eBOSS to make a 3D map of the Universe, and learn more about how galaxies cluster in space. Ultimately, eBOSS aims to precisely measure the expansion rate of the Universe, and reveal more about the nature of the mysterious Dark Energy that accelerates this expansion. The eBOSS spectra are also available in our webapp.
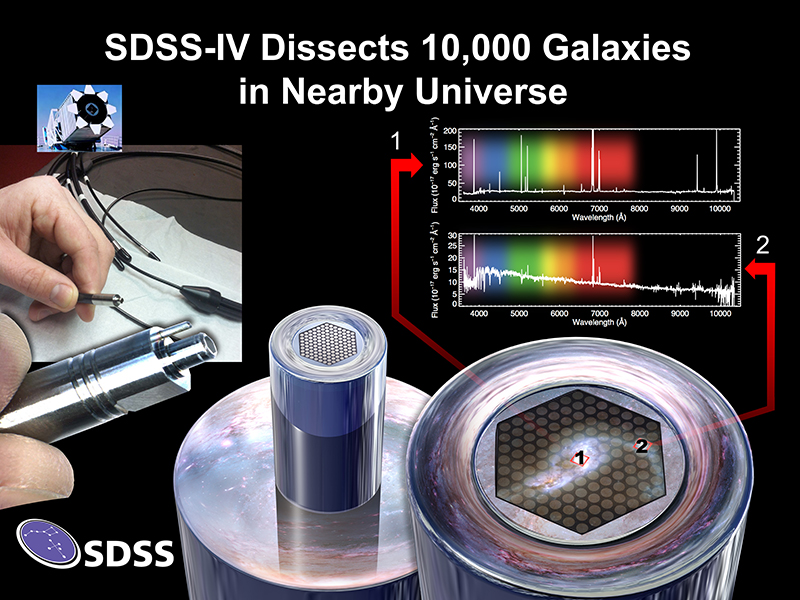
  • MaNGA or Mapping Nearby Galaxies at Apache Point Observatory already released its first data last year, but they’re back with even more data cubes, 2,812 in total! MaNGA uses integral-field spectroscopy to map the properties of galaxies, and find out more about how different galaxies form and evolve. The MaNGA team has prepared a very handy set of tutorials to explain the data cube format, so that anyone can make use of the wealth of information hidden in these galaxy integral-field spectra.

Finally, we’re also very excited to share our new Image Policy with you! We have updated our image license to a Creative Commons Attribution license (CC-BY), which means that any image on our website may now be downloaded, linked to, or otherwise used for any purpose, provided that the image credits are given.

We hope you’ll have fun with all the spectra, catalogs, and tools included in our Fourteenth Data Release, and that they will help you with your science, outreach, teaching, school projects, and anything else!

Anne-Marie Weijmans

SDSS Data Release Coordinator

University of St Andrews

[1] If you are a teacher, we invite you to check out our latest educational guides and activities at SDSS Voyages! We are also developing a Spanish version, available here.

Astronomers studying galaxy mergers using MaNGA data

(The following is a guest post by Lihwai Lin, an assistant research fellow at Academia Sinica, Institute of Astronomy and Astrophysics. She is curretnly chairing the MaNGA merger working group and organized the MaNGA merger mini-workshop described in the article below.)
Galaxies are not isolated. During the lifetime of galaxies, they may encounter another galaxy and merge together to become a larger one. Mergers can induce gas to flow toward the inner parts of galaxies through tidal forces, triggering starbursts or even “switching on” a galaxy’s central black hole (the result is called an “active galactic nucleus,” or AGN). As a result of rapid gas consumption during mergers, a galaxy may lose the majority of its gas and end up as a “dead” system with little on-going star formation. This kind of merger event is rare, but is suggested to be an important process that transforms star-forming galaxies into the quiescent population. One of the key sciences that MaNGA is attempting to address concerns the role of galaxy interactions and mergers in shaping the properties of galaxies. With just one year of the MaNGA survey, we have obtained Integral Field Unit (IFU) observations for ~150 paired galaxies, ranging from early encounters to post-mergers.
Examples of galaxy pairs selected from the SDSS. The magenta hexagons represent the IFU coverage of MaNGA. (Credit: SDSS)

Examples of galaxy pairs selected from the SDSS. The magenta hexagons represent the IFU coverage of MaNGA. (Credit: SDSS)

In early November of 2015, experts studying galaxy mergers gathered together in Taipei for the “SDSS-IV/MaNGA mini-workshop on galaxy mergers”. This 3-day workshop consists of 6 invited talks, 5 contributed talks, plus 2 discussion sessions devoted to theoretical and observational efforts, chaired by Jennifer Lotz (STScI) and Sara Ellison (University of Victoria) respectively.

Participants for the MaNGA mini-workshop on galaxy mergers, held at Academia Sinica, Institute of Astronomy and Astrophysics (ASIAA), Taipei, on Nov. 4-6, 2015.

Participants for the MaNGA mini-workshop on galaxy mergers, held at Academia Sinica, Institute of Astronomy and Astrophysics (ASIAA), Taipei, on Nov. 4-6, 2015.

With MaNGA’s spatially resolved observations for merging galaxies, we can study not only where and when the star formation is triggered and shut down during the process of  galaxy interactions, but also how the massive black holes in the center of galaxies can be fueled and grow through galaxy mergers. The observational results from MaNGA will also be compared in great detail with theoretical predictions from state-of-art simulations. Stay tuned for more exciting science that will come from MaNGA!

P-MaNGA: Emission Lines Properties – Gas Ionisation and Chemical Abundances from Prototype Observations

(The following is a guest post by Francesco Belfiore, a PhD student at Cambridge University’s Kavli Institute for Cosmology, and summarizes his recent paper, which uses preliminary MaNGA data to map gas ionisation in several galaxies.)

Galaxies have long been considered island universes. Ordinarily separated by huge cosmological distances (of the order of millions of light years), most galaxies are not interacting in any visible way with their environment. However, modern theories of galaxy evolution claim otherwise. Starburst galaxies (galaxies which are experiencing a rate of formation of new stars much higher than normal) are known to expel large amounts of ionised (and possibly also neutral) gas towards the intergalactic voids. Supermassive black holes, which we believe to live in the centres of most galaxies, can also give rise to powerful outflows during periods of accretion (when the black hole has “switched on” and is feeding on the surrounding material). Some of these events are violent enough to totally strip a galaxy of its fuel: the gas. Without gas, a galaxy loses its ability to form new stars and becomes progressively older. In a sense, the galaxy has “died”.

This is not the whole story, however.

Continue reading

Integral Field Spectroscopy 101

As frequent readers know, the SDSS-IV-MaNGA survey plans to obtain spatially-resolved spectra of somewhere in the neighborhood of 10,000 galaxies using a technique called integral-field spectroscopy (or IFS). IFS essentially relies on placing an array of fiber-optic cables over an object of interest in the sky, and using the fiber-optics to pipe the light into a spectrograph, which produces the useful data by breaking up that light into its constituent wavelengths (an easy way you can do this at home is with a glass prism). The array of fibers is nicknamed a “bundle,” which is a pre-packaged grouping of fibers that we know the arrangement, and packaging the fibers allows more observational efficiency, since we don’t have to re-position the telescope to make a measurement of the same galaxy at a slightly different point.

However, the specific design of the fiber bundles is an important problem. Continue reading

What is MaNGA (in one sentence)?

MaNGAlogo5small


Some months ago, members of the MaNGA (Mapping Nearby Galaxies at Apache point observatory) survey (part of SDSS-IV) were asked to suggest ideas for a suitable taglines/catchphrase which would describe the survey in one sentence. This idea was that this would go on promotional materials SDSS-IV would take to the American Astronomical Society Meeting, and also the main SDSS website.

The working favourite to that point had been “the galaxy survey for people who love galaxies”, but we wanted something which described the scientific goals of the survey more precisely.

In the word of MaNGA PI, Kevin Bundy this request resulted in an “outpouring of creative, collective genius” (a phrase which Kevin suggested might itself be the appropriate one to describe the MaNGA team).

Here are some of the ideas the team came up with, catagorised by Kevin:

Ideas which reference The 3rd Dimension

  1. .. Now in 3D!
  2. Sloan goes 3D
  3. Sloan Galaxies in three dimensions
  4. Galaxies in 3D
  5. A new dimension in galaxy surveys
10 000 (nearby) galaxies mapped in 3D
  6. A multi-dimensional view of galaxies
  7. Galaxies in 3D by the thousands
  8. Thousands of local galaxies in 3D
  9. Ten thousand Galaxies. Three dimensions

Inspirational ideas

  1. To boldly go where no other Galaxy survey has gone before.
  2. Unravelling the galaxy avatar
  3. Ten thousand mysteries unfold

Direct (or descriptive) ideas:

  1. Census of local galaxies
  2. MaNGA: Deciphering galaxies pixel-by-pixel
  3. Observing the dynamical structures and composition of galaxies to unravel their evolutionary histories
  4. Galaxy birth, assembly, growth and ‘death’
  5. Galaxies Beyond the Central Fiber
  6. Spatially resolved spectroscopy of 10,000 nearby galaxies

Ideas Inspired by Biological Analogies

  1. Galaxy dissection
  2. Galaxies under the microscope
  3. Exploring the life cycle of galaxies
  4. Anatomising galaxies dead and alive
  5. Dissecting galaxies in their dark matter haloes

Humorous suggestions

  1. Galaxies do the full monty
  2. Everything you wanted to know about galaxies, and in 3D
  3. Experience galaxies in 3D, without the glasses

Clever/cultural references

  1. Taking spectra of the spectrum of galaxies
  2. Galaxies in 3D! It’s over 9000!!
  3. 10K3D
  4. How galaxies tick

The final decision was made to go with “Mapping the inner workings of thousands of nearby galaxies” for our website, and we have a banner which says “The 3D Lives of Galaxies”, although we also really like the creative idea of making an API to return all of these randomly.

MaNGA - Mapping the inner workings of thousands of nearby galaxies


Many thanks to: Jeff Newman, Bob Nichol, Kyle Westfall, Surhud More, Karen Masters, Aaron Dutton, Claire Lackner, Mike Merrifield, Daniel Thomas, Eric Emsellem, Carles Badenes, Anne-Marie Weijmans, Brian Cherinka, Demitri Muna, Brett Andrews, Christy Tremonti and Kevin Bundy for contributing ideas.


How SDSS uses light to see dark matter in galaxies

Some of the most beautiful pictures taken by telescopes are those of galaxies. Containing billions of stars, they come in many shapes and sizes. We can study the stellar structures in galaxies from telescope images to learn more about the ways that galaxies form and evolve. We also can look at gas and dust features in galaxies, and the role that these play in the formation of new stars.

Elliptical galaxy NGC 4636 (left) and spiral galaxy M81 (right), as seen by the Sloan Telescope. The telescope captures the light of the stars, and in M81 we can also see some dust in the spiral arms. Both galaxies reside in large, invisible, dark matter haloes.

Elliptical galaxy NGC 4636 (left) and spiral galaxy M81 (right), as seen by the Sloan Telescope. The telescope captures the light of the stars, and in M81 we can also see some dust in the spiral arms. Both galaxies reside in large, invisible, dark matter haloes.

Yet, the largest and most massive component of a galaxy, the dark matter halo, is truly invisible. Dark matter is not made out of ‘normal material’ or baryons, which are the building blocks of stars, planets and all other matter surrounding us. Instead, dark matter is thought to be an exotic particle that does not emit or absorb any light: it does not interact with the electromagnetic force like normal matter. So how do we then know that the dark matter is there?

The answer lies in the light that we observe from the stars and the gas in galaxies. With images we capture the presence of light, but with spectrographs we unravel the light into different colours or wavelengths. The resulting galaxy spectra show us how the stars are moving around in the galaxy. In most galaxies, the stars will rotate around the centre of the galaxy, and this rotational velocity can be seen in the spectrum by a shift in the stellar absorption lines. This shift results from the Doppler Effect, which causes the lines of stars that move away from us to shift towards the red part of the spectrum, while the lines of stars that are moving towards us shift to the blue part of the spectrum. This way, we can find out how fast the stars in a galaxy are rotating around the galaxy centre. But there is more information in the spectrum: the lines are not infinitely thin, but are slightly broadened. This broadening is called ‘velocity dispersion’ and is caused by the additional random motions of the stars. With the new Sloan Survey, MaNGA, we are measuring the rotational and random motions of the stars in 10,000 galaxies. And because MaNGA is an integral-field spectrograph, we can map these motions not only in the very centre of the galaxies, but also in their outskirts, as shown below.

MaNGA is an integral-field spectrograph, capturing spectra at multiple points in the same galaxy with a fiber bundle. The bottom right illustrates how each fiber will observe a different section of the galaxy. The top right shows data gathered by two fibers observing two different part of the galaxy, showing how the spectrum of the central regions differs dramatically from outer regions. From these spectra, we measure the rotational and random motions of stars, to deduce how much dark matter is present in the galaxy. Image Credit: Dana Berry / SkyWorks Digital Inc., David Law, and the SDSS collaboration

How do these velocity and dispersion maps help us to find the dark matter? The answer is gravity. The stars are moving around in a galaxy under the influence of gravity: the more matter (mass) there is in the galaxy, the faster the stars are moving. Now that we have measured the movements of the stars in the galaxies, we can deduce how much matter is needed to have the stars move around with those measured velocities. And we can compare that gravitational mass with the luminous mass in the galaxy (the stars, gas and dust). For all galaxies studied so far, the gravitational mass is much larger than the luminous mass: hence the need for dark matter.

Example of a galaxy observed with MaNGA. Left is the image of the galaxy, showing the stellar light. The middle image is the rotational velocity field of the galaxy: the red part of the galaxy is moving away from us with 254 km/s, and the blue part of the galaxy is moving towards us with the same velocity. The green axis down the middle is the rotation axis. The right image shows the random motions of the stars: these are higher in the centre (red: 257 km/s) than in the outskirts of the galaxy (blue: 94 km/s). Figure taken from Bundy et al. 2015.

Example of a galaxy observed with MaNGA. Left is the image of the galaxy, showing the stellar light. The middle image is the rotational velocity field of the galaxy: the red part of the galaxy is moving away from us with 254 km/s, and the blue part of the galaxy is moving towards us with the same velocity. The green axis down the middle is the rotation axis. The right image shows the random motions of the stars: these are higher in the centre (red: 257 km/s) than in the outskirts of the galaxy (blue: 94 km/s). Figure taken from Bundy et al. 2015.

Sophisticated mass or dynamical models of the galaxies, based on the observed velocity and dispersion maps, tell us how the luminous and dark matter are distributed in the galaxy, and what the properties (mass, size, concentration) of the dark haloes are. Comparing these mass models with predictions from galaxy formation theories will help us forward in our quest to understand galaxies, and the dark haloes that surround them. But it all starts with capturing the stellar light of galaxies in spectrographs, to map the invisible.


This post was written by Dr. Anne-Marie Weijmans (St Andrews) and is part of the SDSS Celebration of the International Year of Light 2015, in which we aim to post an article a month about how SDSS uses light in our mission to study the Universe.

MaNGA’s First Galaxies

A post by Anne-Marie Weijmans, the MaNGA Lead Observer: 

Last month MaNGA (Mapping Nearby Galaxies at APO) had its first commissioning run at Apache Point Observatory, with its first installed cartridge. MaNGA is part of SDSS-IV and scheduled to start observing in July of this year, but it now already has its first galaxies in hand!

MaNGA is an integral-field spectroscopy survey, which will map the motions and properties of stars and gas in 10,000 galaxies. By grouping fibers together into integral-field units, MaNGA obtains spectra not just of the centre of the galaxy, but also its outskirts, covering the whole galaxy. This means that we can measure properties of stars, such as age and metallicity, over a large surface area in the galaxy, and based on that, figure out how these galaxies were assembled. We also are able to measure the velocities of the stars, which in turn tells us about the structure of the galaxy, and how much dark matter is present. From the gas, we learn about the radiation present in the galaxy: is the gas energized by young stars (indicating that there is on-going star formation), by an active black hole, or both? Combining all these different sets of information, we form a picture of how different galaxies form, and evolve over time.

Niv and Nick installing the cartridge

MaNGA chief engineer Nick MacDonald (UW) and instrument scientist Niv Drory (UT at Austin) inspecting the first MaNGA cartridge, before mounting it to the telescope (credit: A. Weijmans).

MaNGA instrument scientist Niv Drory (UT at Austin) and chief engineer Nick MacDonald (UW) prepared the cartridge, carefully adding the MaNGA integral-field units and making sure that the surfaces of the fibers were clean to optimize their light throughput. The observers at APO, together with MaNGA lead observer Anne-Marie Weijmans and several other members of the MaNGA team took various test-observations of sky and stars, before turning their attention to galaxies. MaNGA can observe 17 galaxies in one go, and with two plates completed this resulted in 34 galaxies.

MaNGA Observing Team

The MaNGA observing team at APO. From left to right: David Law (Toronto), John Parejko (Yale), Niv Drory (UT at Austin), Nick MacDonald (UW), PI Kevin Bundy (IPMU), Anne-Marie Weijmans (St Andrews), Renbin Yan (Kentucky), Brian Cherinka (Toronto), José Sánchez-Gallego (Kentucky) and Hai Fu (Iowa). (credit: D.R. Law).

Right now, two more cartridges are being prepared for MaNGA to start observing this summer, and in the Fall, three more cartridges will follow. And at the same time, MaNGA lead data scientist David Law (Toronto) and survey scientist Renbin Yan (Kentucky) with many other members of the MaNGA team are working hard to analyze the results of these first 34 galaxies. Only 9,966 more to go!

MaNGA First Galaxies

One plate full of galaxies. These galaxies are the very first ones observed by the final MaNGA instrument. Some galaxies have been off-set from the centre of the IFU to allow inclusion of foreground stars, to test our measurement precisions. (credit: K. Bundy).

To keep in touch with MaNGA and see what we are up to, follow us on Twitter @MaNGASurvey.

A few more pictures:


MaNGA plate

MaNGA galaxy plate, showing the holes for the MaNGA IFUs and sky fibers (credit: D.R. Law)

Anne-Marie plugging a MaNGA plate

Attempt at plugging a MaNGA plate by lead observer Anne-Marie Weijmans (St Andrews), (credit N. Drory).

Stargazing

MaNGA observers watching the stars (credit: D.R. Law).


MaNGA Pre-Survey Review and Team Meeting in Portsmouth, UK

Around 45 astronomers have been in Portsmouth, England this week attending the MaNGA Pre-Survey Review and Team Meeting.

MaNGA  (Mapping Nearby Galaxies at APO) is part of the plans for the next phase of the Sloan Digital Sky Survey (along with eBOSS and APOGEE2) due to start in July of this year.

Image

The MaNGA Team and Review Panel in front of the Institute of Cosmology and Gravitation at the University of Portsmouth. Image Credit: Edd Edmondson

As well as the full science program, the astronomers have been enjoying the British pubs, Indian Food, and historic Naval ships to be found in Portsmouth.

Image

The MaNGA Team enjoyed a special tour of HMS Warrior 1860 in the Portsmouth Historic Dockyard. Here shown just before sunset on Wednesday. Image Credit: Karen Masters

The MaNGA Team are happy with the outcome of the review, and it’s full speed ahead to survey operations. The discussions continue today and tomorrow with open issues and plans for early science papers.