SDSS Plates as Art in Nashville, Tennessee

Check out these cool art pieces made from SDSS spectroscopic plates!  Nashville based artist, Adrienne Outlaw, designed and built them and they will be exhibited in various locations at Vanderbilt University over the next year. The pictures show their first installation, just in time for the Inclusive Astronomy meeting that started yesterday. The concept design was done by Adrienne Outlaw in collaboration with Vanderbilt astronomers David Weintraub and Billy Teets, and the project was funded by Vanderbilt University’s Curb Creative Campus program.

If you want to learn more about what these plates are, and see them in other art installations please see this previous post on SDSS plates.

We love seeing images of SDSS plates around the world. Please send any you find to us via social media (you can find us on Facebook, Twitter and Google+), or email to outreach ‘at’ sdss.org.

unnamed-1

unnamed

SDSS at the New York Hall of Science

A few months ago (at the end of March), SDSS Members spent a Saturday taking part in the Big Data Fest at the New York Hall of Science, in Queens, NY.

This event was aimed at helping people find out how data is relevant to their lives and featured interactive experiences focused on data literacy and data gathering and visualization.

2014-03-08 10.51.19

Chang Hahn and Yuqian Liu from NYU ready to go with the SDSS booth

Seven SDSS members in total helped out – six from NYU (Chang Hahn, Yuqian Liu, Nitya Mandyam Doddamane, Kilian Walsh, Ben Weaver, and Mike Blanton), along with Guang Yang who travelled up from Penn State University (PSU). This group ran one of about a dozen booths spread throughout the Hall of Science buildings in between the regular exhibits.

The SDSS booth contained an SDSS plate, along with a large-scale printout of the imaging for the part of the sky it was designed for. There was also a set of flash cards with images of galaxies on them, next to an invitation to try classifying them. Visitors were invited to take a card home with them if they wished. There were laptops running both Galaxy Zoo and the SDSS SkyServer. The SkyServer demo was set up to allow visitors to explore the data taken with the plate on display. Finally a monitor displayed a loop of videos about SDSS from the SDSS YouTube Channel.

Galaxy flashcards ready for classifying.

Galaxy flashcards ready for classifying.

The audience were made up of a mixture of children, teenagers and adults (including some who were very scientifically literate). The location in Queens meant that it was mostly NY area residents – with fewer tourists than Manhatten based museums attract.

Nitya Mandyam Doddamane and Yuqian Liu talks about SDSS with some visitors, while Chang Hahn is running a demo of Skyserver.

Nitya Mandyam Doddamane and Yuqian Liu talks about SDSS with some visitors, while Chang Hahn is running a demo of Skyserver.

This event at the NY Hall of Science is just one example of SDSS scientists around the world working to engage members of the public with our data. If you are running a similar event and might be interested in seeing if SDSS would be able to participate, please contact outreach ‘at’ sdss.org and we will try to connect you with your nearest SDSS institution.

APOGEE-South: Plate-Pluggers and Tripods – APOGEE-Sur: Conexión de Placas y Trípodes

Recently, a small group of astronomers from Chile has been visiting Apache Point Observatory. Their job will be to assist with operations at APOGEE-South, which is being built for the Irénée du Pont telescope at Las Campanas Observatory. Introducing: Christian Nitschelm, a faculty member at Universidad de Antofagasta; Andrés Almeida, a Masters student from Universidad Andrés Bello; and Jaime Vargas, Masters student at Universidad de La Serena.

Recientemente, un pequeño grupo de astrónomos de Chile ha estado visitando el Observatorio Apache Point (APO por sus siglas en Inglés). Su trabajo consistirá en ayudar con las operaciones en APOGEE-Sur, que se está construyendo para el telescopio Irénée du Pont en el Observatorio Las Campanas. Presentamos a: Christian Nitschelm, profesor en la Universidad de Antofagasta; Andrés Almeida, un estudiante de Maestría de la Universidad Andrés Bello; y Jaime Vargas, estudiante de Maestría de la Universidad de La Serena.

Jamie (left) Christian (center), and Andres (right), unplugging an APOGEE plate after observations. Jamie (a la izquierda), Christian (al centro), y Andrés (a la derecha), desconectando las fibras ópticas de una placa de APOGEE después de las observaciones.

Jamie (a la izquierda), Christian (al centro), y Andrés (a la derecha), desconectando una placa de APOGEE después de las observaciones.
Jamie (left) Christian (center), and Andres (right), unplugging an APOGEE plate after observations.

While at APO, Jamie, Christian, and Andres are learning a number of important skills that they will take back to Las Campanas Observatory. This includes plugging and unplugging plates:

Mientras tanto en el APO, Jamie, Christian y Andrés están aprendiendo una serie de técnicas importantes que llevarán al Observatorio Las Campanas. Esto incluye conectar y desconectar las placas:

Christian and Jamie seen here plugging fibers into a plug plate. Christian y Jaime se ven aquí conectando las fibras en una placa de conexión.

Christian y Jaime se ven aquí conectando las fibras ópticas en una placa de conexión.
Christian and Jamie seen here plugging fibers into a plug plate.

They are also learning to use the new Mock Up and Training Facility tripod, cartridge, and dolly (seen below). This setup will be sent down to Universidad de La Serena so that this crew can train future support staff.

También están aprendiendo a usar la maqueta y trípode de capacitación, el cartucho y carro (observados a continuación). Esta configuración se enviará a la Universidad de La Serena para que este equipo de trabajo pueda entrenar el personal de apoyo futuro.

Christian and Jamie swapping out a plug plate cartridge with the Mock Up and Training Facility tripod (the big steel frame), cartridge (the blue object suspended from the tripod) and dolly, which will be used to transport plug plates to and from the telescope. Christian y Jaime intercambiando el cartucho de la placa conexión con la maqueta y el trípode de capacitación (la estructura de acero grande), el cartucho (el objeto azul suspendido del trípode) y el carro, que será utilizado para transportar las placas de conexión hacia y desde el telescopio.

Christian y Jaime intercambiando el cartucho de la placa conexión con la maqueta y el trípode de capacitación (la estructura de acero grande), el cartucho (el objeto azul suspendido del trípode) y el carro, que será utilizado para transportar las placas de conexión hacia y desde el telescopio.
Christian and Jamie swapping out a plug plate cartridge with the Mock Up and Training Facility tripod (the big steel frame), cartridge (the blue object suspended from the tripod) and dolly, which will be used to transport plug plates to and from the telescope.

“Torquing” the plug plate slightly is a necessary skill so that it aligns with the field of curvature of the telescope. Using a ring around the plate (shown being attached below), the plate can be bent ever so slightly:

“Torcer” ligeramente la placa de conexión es una habilidad necesaria para alinear la placa con el campo de curvatura del telescopio. Usando un anillo alrededor de la placa (mas abajo se ve como se engancha), ésta se puede doblar ligeramente:

Christian and Andres attaching the bending ring around the plate. Christian y Andrés enganchan el anillo de flexión alrededor de la placa.

Christian y Andrés enganchan el anillo de flexión alrededor de la placa.
Christian and Andres attaching the bending ring around the plate.

And, of course, it is important to check your work. In this case, a computer is used to map the locations of fibers on the plate, ensuring that they will be on target when the plug plate is used on the telescope:

Y, por supuesto, es importante revisar su trabajo. En este caso, se utiliza un ordenador para mapear las ubicaciones de fibras en la placa, asegurando que van apuntar al objeto cuando la placa de conexión se use en el telescopio:

20150528_084335

Christian utiliza una computadora para medir el perfil de la placa de conexión después de que ha sido mapeada. Esto asegurará que la placa ha sido “torcida” correctamente.
Christian using a computer to measure the profile of the plug plate after it has been mapped. This will ensure that they have “torqued” the plate properly.


Jamie is enjoying his new skills set! Here, he is drawing an overlay on a plug plate to prepare it for plugging. ¡Jaime disfruta de sus nuevas habilidades! Aquí está dibujando una superposición en una placa de conexión para prepararla para la conexión.

¡Jaime disfruta de sus nuevas habilidades! Aquí está dibujando una superposición en una placa de conexión para prepararla para la conexión.
Jamie is enjoying his new skills set! Here, he is drawing an overlay on a plug plate to prepare it for plugging.

Special thanks to Veronica Motta, Professor of Astronomy at Universidad de Valparaíso, for translating the English into Spanish.

How SDSS Used Light to Make the Largest Ever Image of the Night Sky

The Sloan Digital Sky Survey imaged over 30% of the sky between the years of 1998-2008, creating the largest digital colour image of the sky ever taken. To view all of the SDSS imaging at once, would require 500,000 HD televisions (so it can be displayed at full resolution), and with more than a trillion pixels, this image dwarfs the 1.5 billion pixel image that NASA recently claimed was the biggest ever taken.

The SDSS Camera which took all of this imaging is now retired, and was collected by the Smithsonian Institution, to be packed away in a basement as an “artifact of scientific significance”.

The SDSS Camera in its current home - a basement of the Smithsonian Museum in Washington, D.C. Image Credit: Xavier Poultney, SDSS.

The SDSS Camera in its current home – a basement of the Smithsonian Museum in Washington, D.C. Image Credit: Xavier Poultney, SDSS.

The SDSS camera was made by arranging together an array of thirty, 2048×2048 pixel CCD chips. In the 1990s this was state-of-the-art, and even today a 126 Megapixel camera is nothing to sniff at (e.g the current state-of-the-art is DECam which has 62 CCDs and a total of 520 Megapixels).

The CCD chips in the SDSS camera were aligned in five columns, each covered by one of the five filters used to make the colour imaging (the u-, g-, r-, i- and z-bands, roughly corresponding to collecting light in the near-ultraviolet, green, red, near-infrared and a bit less near-infrared respectively).

faceplat2

An illustration of the arrangement of the CCDs and filters on the camera. The filters from top to bottom are r, i, u, z and g-band. Image credit: SDSS.

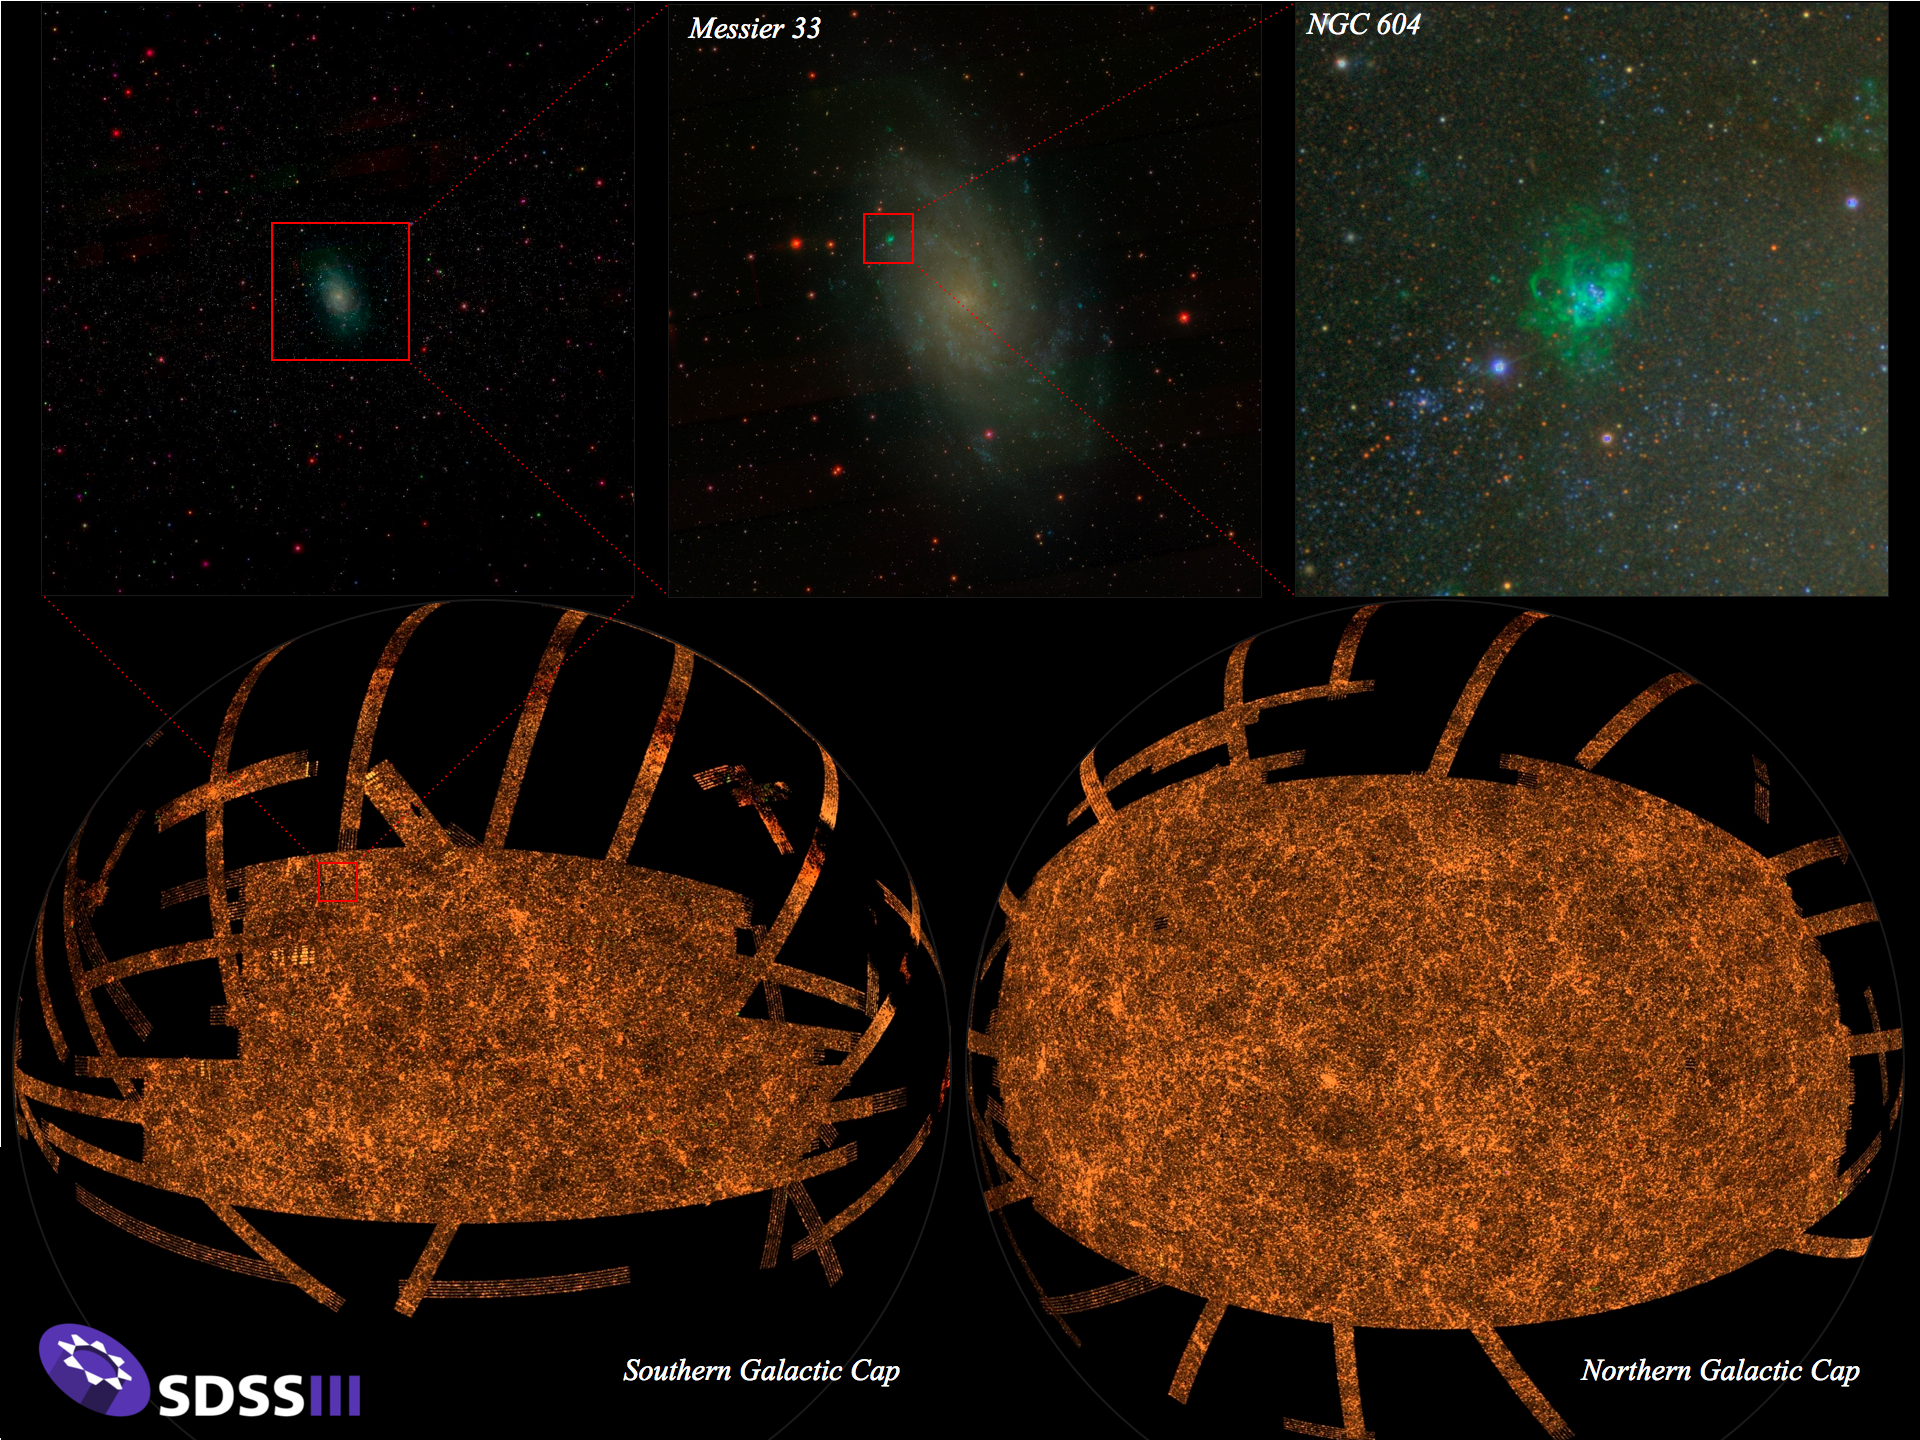
This arrangement meant that the camera could take images continuously as the Earth rotated and moved it with respect to the sky overhead. SDSS images are therefore arranged in long stripes of constant Declination across the sky (the most famous being “Stripe 82” which was imaged many times). You can make out some of these stripes around the edges of the stitched together image (the “legs of the orange spider” below).

Orange Spider! This illustration shows the SDSS imaging on many scales. The picture in the top left shows the SDSS view of a small part of the sky, centered on the galaxy Messier 33 (M33). The middle and right top pictures are further zoom-ins on M33. The figure at the bottom is a map of the whole sky derived from the SDSS image. Visible in the map are the clusters and walls of galaxies that are the largest structures in the entire universe. Figure credit: M. Blanton and SDSS

All SDSS imaging is publicly available and can be explored online via the SDSS Skyserver. The Navigate Tool is especially fun as you can scroll around the entire image.

A much more technical description of the camera can be found in Gunn et al. (1998) and in the SDSS-I project book.


This post is part of the SDSS Celebration of the International Year of Light 2015, in which we aim to post an article a month about how SDSS uses light in our mission to study the Universe. 

SDSS Plates for Education

Here at SDSS we’re working on a new educational initiative, where teachers and informal educators will be able to take back to their classroom their very own piece of SDSS history – an actual SDSS plate which was used to map a small patch of the night sky.

We have been developing a “Plate packet” to distribute to teachers and educators. This packet contains an SDSS plate, along with a custom made poster showing the SDSS image of the region of sky the plate was designed for, as well as some selected educational materials, and links to specially designed activities on SDSS Voyages.

Certificate handed out with each plate.

Certificate handed out with each plate.

On Saturday 30th May 2015, SDSS Members from the University of Washington handed out the first plates to a group of  teachers representing high schools from around the western Washington, USA. These teachers spent the day at the in Seattle discussing ideas for using the plates in their classrooms, as well as getting a tour of the machine shop, where all the SDSS plates are manufactured.

IMG_0582

“Hard at Work”: SDSS Member Oliver Fraser (pink shirt) shows some educators how to find the data from their plates and use it for classroom investigations. A plate poster can be seen on the board in back. Credit: Danielle Skinner

Photo May 30, 2 41 54 PM

“Yay Plates!”: some happy educators (and SDSS Member, Danielle Skinner in black) excited to be taking their very own SDSS plates back to their schools. Credit: Oliver Fraser.

The University of Washington is already planning more such workshops, and we look forward to expanding this program to other SDSS Member Institutions.


If you’re a teacher or educator reading this and interested to know how you can get your own SDSS plate, please contact the outreach representative at your nearest SDSS Institution, or email outreach ‘at’ sdss.org for assistance doing that. SDSS members interested in getting involved in this programme should join the EPO mailing list (details on the password protected collaboration wiki). 

David Schlegel Wins an Ernest Lawrence Award

Prof. David Schlegel of Lawrence Berkeley National Laboratory, the PI of the BOSS part of SDSS-III and a long time contributor to all areas of the Sloan Digital Sky Surveys was announced yesterday as one of the winners of the E.O. Lawrence Award.

David Schelegel, PI of BOSS, shows off a plug plate. Image credit: LBL

David Schelegel, PI of BOSS, shows off a plug plate. Image credit: LBL

The Ernest Orlando Lawrence Award was established in 1959 in honor of Ernest Lawrence, who invented the cyclotron (for which he won 1939 Nobel Laureate in physics). The Lawrence Award honors U.S. scientists and engineers, at mid-career, for exceptional contributions in research and development supporting the Department of Energy and its mission to advance the national, economic and energy security of the United States.

The citation for David’s award (for the High Energy Physics Category of the award) reads:

Honored for his exceptional leadership of major projects making the largest two-dimensional and three-dimensional maps of the universe, which have been used to map the expansion rate of the Universe to 10 billion light years and beyond. His fundamental technical contributions to high precision measurements of the expansion history of the Universe, and his massive galaxy redshift surveys to detect baryon acoustic oscillations, has helped ascertain the nature of Dark Energy, test General Relativity, and positively impact fundamental understanding of matter and energy in the universe.  These efforts have made precision cosmology one of the most important new tools of high-energy physics.

All of us at SDSS are delighted to wish David Schlegel many congratulations for this honor.

The SDSS Reverberation Mapping Project

The below post was contributed by Dr. Catherine Grier, a postdoctoral researcher at Penn State University (formerly a graduate student from Ohio State University, and the Director of the OSU Planetarium) who has led a recent paper based on results from the SDSS Reverberation Mapping Project (accepted for publication in the Astrophysical Journal; the full text is available at: arXiv:1503.030706 Screen Shot 2015-05-21 at 17.16.00 Supermassive black holes (SMBHs) are present in all massive galaxies and are thought to affect the formation and development of the galaxies themselves. Because of this, understanding SMBHs is important in understanding how galaxies are formed and evolve. Observations of quasars are key to understanding SMBHs and how they affect their host galaxies: Quasars are enormously powerful, observable at great distances, and can potentially regulate the growth of their galaxies through their winds, or outflows. We learn about these winds by observing broad absorption line features (BALs; see the diagram below) in quasar spectra that are created by high-speed winds launched from the quasar accretion disk. These winds are made of gas that blocks the light from the quasar and show up as BALs in the spectra of quasars.

Slide1

The CIV region of our target showing the CIV Broad Absorption Line (BAL) features investigated in our study.

These absorption features change throughout time, both in strength and in shape. Under the right conditions, we can use the details of the variability to learn about the density of the absorbing gas and the distance of the gas from the SMBH. This information can sometimes be used to determine if the outflow is powerful enough to affect the star formation in their host galaxy. Previous studies have found that BALs are variable on timescales of several years all the way down to timescales of 8-10 days; however, until now, no studies have reported variability on timescales shorter than 8-10 days. In our recent work, we report on very short-timescale (~1 day) BAL variability observed in a SDSS quasar. The spectra used in our study were taken as a part of the SDSS Reverberation Mapping (SDSS-RM) project using the BOSS spectrograph. We monitored 850 quasars with the BOSS spectrograph from January 2, 2014 through July 3, 2014, resulting in 32 observations over this period. The main goal of the SDSS-RM program is the investigation of the broad emission line regions of quasars, but the targets include a number of quasars hosting BALs and can be used for BAL studies too. During our observing campaign, the equivalent width, or strength, of the highest-velocity CIV BAL feature (see above diagram) changed by over a factor of 2. We did not observe similar variations in either the CIV broad emission line or the overall brightness of the quasar, and the shape of the BAL feature stayed roughly the same during the entire campaign. We observed significant changes in the strength of the BAL on timescales as low as 1.20 days in the quasar rest frame (see the graphs below). This is the shortest time frame ever reported over which significant variability in a BAL trough has been observed.

Slide2

Four different pairs of spectra between which the CIV BAL trough varies significantly.

The most likely cause of the variability is a change in the amount of ionized gas in the outflow. This could be caused by changes in the brightness of the quasar or the amount of energy reaching the absorbing gas for various other reasons. With our observations, we are unable to determine whether this outflow contributes significantly to feedback to the host galaxy, but we do not rule out the possibility. The key to observing this short-term variability was the high cadence of the SDSS-RM campaign, which allowed us to search for BAL variability on shorter timescales than previous studies. This program is still ongoing; we expect to receive more spectra of this target over the next few years with the eBOSS spectrograph, which could shed further light on this topic. The variability properties of this target are similar to those found in other quasars, suggesting that this short-term variability may be common. Further high-cadence spectroscopic campaigns targeting BAL quasars would allow us to learn more about BAL variability in quasars and better understand the possible contributions of BALs to feedback to their host galaxies.

Engineering Work for APOGEE-South – Trabajo de ingenieria en APOGEE-Sur

Telescopes at LCO

The du Pont 2.5m telescope on the middle-left, and the pair of Magellan 6.5m telescopes on the right.
El telescopio de 2.5m du Pont al centro hacia la izquierda y los dos telescopios de 6,5m, Magallanes, a la derecha.

A half-dozen SDSS scientists and engineers traveled to Las Campanas Observatory, Chile at the beginning of March to continue work on characterizing the 2.5m du Pont telescope performance in preparation for the first APOGEE-South hardware tests in August. This report is from the SDSS Operations Software Manager John Parejko, who was part of the run (and ended up involved in some hardware tests, against his better judgement!). Translated into Spanish by Verónica Motta, Full Professor of Astronomy at Valparaiso University.

Las Campanas Observatory currently hosts three “large” telescopes (greater than 2 meters diameter), and a number of 1 meter diameter and smaller telescopes. The 2.5m du Pont telescope (in use since 1977) is a much older telescope than the 2.5m Sloan telescope at APO (in use since 1999), but it is at an excellent site, its optics are still very good–I heard them referred to as “superb” on several occasions–and it has a large field of view. With the assistance of the telescope’s owners–the Carnegie Institution of Washington–SDSS plans to help design improvements to the telescope drive systems so that we can run an APOGEE-South survey and fully sample the Milky Way’s bulge.

Una media docena de científicos e ingenieros del SDSS viajaron al Observatorio Las Campanas (Chile) a principios de marzo para continuar el trabajo de caracterización del rendimiento del telescopio de 2.5m du Pont en preparación para la primera prueba de hardware de APOGEE-Sur que se realizara en agosto. Este informe proviene del Director de Operaciones de Software del SDSS, John Parejko, que participó en la ejecución (y que terminó involucrado en algunas pruebas de hardware, en contra de su mejor juicio ! ). Traducción de Verónica Motta, profesor de astronomía en la Universidad de Valparaíso.

El Observatorio Las Campanas actualmente alberga tres “grandes” telescopios (mayores de 2m de diámetro), y varios más pequeños de hasta 1m de diámetro. El telescopio de 2.5m du Pont (en uso desde 1977) es más antiguo que el telescopio de 2.5m Sloan en el Observatorio Apache Point (APO, en uso desde 1999), pero está en un lugar excelente, su óptica es todavía muy buena -he oído referirse a ella como “excelente” en varias ocasiones- y tiene un gran campo de visión. Con la ayuda de los propietarios del telescopio -la Institución Carnegie de Washington- el SDSS planea ayudar a mejorar el diseño de los sistemas de accionamiento del telescopio de manera que podemos realizar el relevamiento APOGEE-Sur y muestrear completamente el bulbo de la  Vía Láctea.

Paul and Nick looking at the rotator

Paul Harding and Nick MacDonald looking at the rotator.
Nick MacDonald y Paul Harding investigan las propiedades físicas del rotador del du Pont.

In order to determine what improvements the telescope requires, we have to make precise measurements of how different parts of the telescope move. From previous work, we found that the Right Ascension and Declination motors (equivalent to latitude and longitude projected onto the sky) probably don’t need much work. This trip, we measured the motion of the rotator and focus systems. Carnegie is in the process of completing their own upgrades to the telescope, and our measurements will help guide these changes.

Con el fin de determinar qué mejoras necesita el telescopio tenemos que hacer mediciones precisas de cómo se mueven las diferentes partes del telescopio. A partir de trabajos anteriores, encontramos que los motores de la Ascensión Recta y de la Declinación (equivalentes a la latitud y a la longitud proyectada sobre el cielo) probablemente no necesitan mucho trabajo. En este viaje medimos el movimiento del rotador y del sostema de enfoque. Carnegie se encuentra en el proceso de terminar sus propias mejoras al telescopio y nuestras medidas servirán de guía para estos cambios.

Author self portrait in a primary. You can see the reflection of the secondary mirror and its light baffles just above my head.

Author self portrait in a primary. You can see the reflection of the secondary mirror and its light baffles just above my head.
Autorretrato del autor en el primario, se puede ver el reflejo del espejo secundario y su luz que pasa justo por encima de mi cabeza.

To focus a telescope like this one, you move the secondary mirror. Even tiny changes in the position or tilt of the secondary can result in incorrect or uneven focus when you need a large field of view, as APOGEE will. As the du Pont is an older telescope, the system that moves the secondary mirror may not be as stable as APOGEE requires.

We first checked whether the mirror moved the exact amount each time it was commanded. We’ve found that the mirror motors need to be more repeatable: moving 500 “up” and then 500 “down” should return to exactly the same place, but it doesn’t. The Carnegie engineers are now working to improve the motors and control systems to fix this.

Para enfocar un telescopio como éste se mueve el espejo secundario. Incluso pequeños cambios en la posición o en la inclinación del secundario pueden resultar en un foco incorrecto o irregular en un gran campo de visión como el que utilizará APOGEE. Como el telescopio du Pont es viejo, el sistema que mueve el espejo secundario puede no ser tan estable como requiere APOGEE.

Primero revisamos si el espejo se movió la cantidad correcta cada vez que se le ordenó. Hemos encontrado que los motores del espejo tienen que ser más confiables: moverse 500 hacia “arriba” y después 500 hacia “abajo” debería regresarlo exactamente al mismo lugar, pero no es así. Los ingenieros de Carnegie están trabajando para mejorar la motores y los sistemas de control para solucionar este problema.

Author self portrait in the du Pont secondary, with my camera and our measuring target visible.

Author self portrait in the du Pont secondary, with my camera and our measuring target visible.
Autorretrato del autor en el secundario del du Pont, con mi cámara y nuestro objeto de medición visible.

To measure any shift or tilt in the secondary, we used a rather interesting system: a typical camera (the Panasonic G2 that I travel with for touristy photos; it took all the pictures shown in this post) with a long telephoto lens mounted on a moveable rail, taking pictures of the image in the secondary mirror of a “target” on the floor. We then took pictures with the camera and measured whether the target moved around: if it doesn’t move from image to image, we know the secondary is very stable against tilts and shifts during movement. We’re still analyzing the results of these tests, and will use them to detail what changes need to be made.

Para medir cualquier desplazamiento o inclinación en el secundario usamos un método interesante: una cámara típica (la Panasonic G2 con la que viajo para tomar fotos turísticas; la que tomó todas las imágenes que se muestran aquí) con un teleobjetivo largo montado en un carril móvil, toma fotos de la imagen en el espejo secundario de un “objetivo” en el suelo. Entonces tomamos fotos con la cámara y medimos si el objetivo se movió: si no se mueve de imagen a imagen, sabemos que el secundario es muy estable ante las inclinaciones y los cambios durante el movimiento. Todavía estamos analizando los resultados de estas pruebas y las usaremos para detallar los cambios deben hacerse.

Además de mi trabajo de ingeniería en el telescopio du Pont, tuve tiempo durante la noche para fotografiar el cielo austral. Este fue mi primer viaje al hemisferio sur y me aseguré de levantarme temprano al menos una mañana para ver las Nubes Mayor y Menor de Magallanes y toda la gloria de la Vía Láctea austral. Tuve que levantarme temprano para evitar la Luna casi llena, que disminuye la visibilidad. Sin duda tienen cielos espectaculares ahí abajo.

In addition to my engineering work on the du Pont telescope, I was able to take some time at night to photograph the southern sky. This was my first trip to the southern hemisphere, and I made sure to get up early at least one morning to see the Large and Small Magellanic Clouds and the full glory of the southern Milky Way. I had to get up early in order to avoid the nearly-full moon, which otherwise much diminished the view. They’ve certainly got some spectacular skies down there!

The southern hemisphere Milky Way and Large Magellanic Cloud, over the main LCO building.

La Vía Láctea y las Nubes Mayor y Menor de Magallanes Nube en el hemisferio austral, sobre el edificio principal del LCO.
The southern hemisphere Milky Way and Large Magellanic Cloud, over the main LCO building.

Pasé mis últimos días de este viaje en la ciudad de La Serena, reunido con la gente de la Universidad de La Serena (ULS) y reuniendo los resultados de las pruebas. Durante este tiempo, pude ver como la escuela de ingeniería ULS  maniobró la nueva máquina, marca Mazak CNC, con cuidado hasta su lugar en el taller de mecánica. Las instituciones chilenas han utilizado la colaboración SDSS/Chile para reforzar su infraestructura a través de subvenciones y varios acuerdos. En este caso, fueron capaces de comprar el modelo más avanzado de fresadora computarizada que planean utilizar para construir piezas para APOGEE-Sur.Tengo ganas de ver que pueden construir con ella!

I spent my last days of this trip in the city of La Serena, meeting with people at the University de La Serena (ULS) and collating results from the tests. During this time, I was on hand to watch as the ULS engineering school had a brand new Mazak CNC machine carefully maneuvered into place in their machine shop. Chilean institutions have used the SDSS/Chile collaboration to bolster their on-site infrastructure via grants and various agreements. In this case they were able to purchase a state-of-the- art computerized milling machine that they plan to use to construct parts for APOGEE-South. It will also provide engineering student training and experience, and allow the university to construct other cutting edge scientific equipment in the future.

I’m looking forward to see what they can build with it!

Happy Engineers standing in front of their just-delivered CNC machine. Ingenieros felices de pie frente a su recién entregada máquina CNC.

Ingenieros felices de pie frente a su recién entregada máquina CNC.
Happy Engineers standing in front of their just-delivered CNC machine.

Job Posting: University of Washington Machine Shop Manager

The University of Washington Physics Instrument Shop is looking for a new shop manager.  This is the machine shop which builds the SDSS plug plates, fiber systems, and a number of our other instrumentation and telescope equipment for SDSS, APO 3.5 m, and soon LCO. This shop is a key part of SDSS operations.

Position Description

The Instrument Shop Manager is responsible for the daily operations of a 5 FTE research and development machine shop with an $850,000 annual budget.  The Instrument Shop provides clients (primarily scientists) with both one-of-a-kind and production instruments.  The manager is solely responsible for assessing each client’s request, estimating the amount of time and effort to complete the job, assigning the job to the staff persons whose abilities and experience best fit the request and scheduling the job.  The Manager is the line supervisor for 5 FTE – selecting, hiring, evaluating and disciplining employees as necessary.   The Manager ensures that the proper tooling and materials are on hand for each job, that machines are maintained and repaired and that the workplace is safe. The Manager works closely with faculty, staff and students on their research projects.  Many experiments involve instruments that are not available ‘off the shelf’ and are custom designed for each particular experiment or project.  Faculty, staff and students depend upon the Manager to review their ideas and ensure that the devices are buildable and suggest modifications that may result in a better instrument or make it easier to produce.

Link to the job posting. 

You can get an idea of what goes on in this shop in this video of SDSS plate production
[youtube https://www.youtube.com/watch?v=iYyO7pGaJNw]

How SDSS uses light to see dark matter in galaxies

Some of the most beautiful pictures taken by telescopes are those of galaxies. Containing billions of stars, they come in many shapes and sizes. We can study the stellar structures in galaxies from telescope images to learn more about the ways that galaxies form and evolve. We also can look at gas and dust features in galaxies, and the role that these play in the formation of new stars.

Elliptical galaxy NGC 4636 (left) and spiral galaxy M81 (right), as seen by the Sloan Telescope. The telescope captures the light of the stars, and in M81 we can also see some dust in the spiral arms. Both galaxies reside in large, invisible, dark matter haloes.

Elliptical galaxy NGC 4636 (left) and spiral galaxy M81 (right), as seen by the Sloan Telescope. The telescope captures the light of the stars, and in M81 we can also see some dust in the spiral arms. Both galaxies reside in large, invisible, dark matter haloes.

Yet, the largest and most massive component of a galaxy, the dark matter halo, is truly invisible. Dark matter is not made out of ‘normal material’ or baryons, which are the building blocks of stars, planets and all other matter surrounding us. Instead, dark matter is thought to be an exotic particle that does not emit or absorb any light: it does not interact with the electromagnetic force like normal matter. So how do we then know that the dark matter is there?

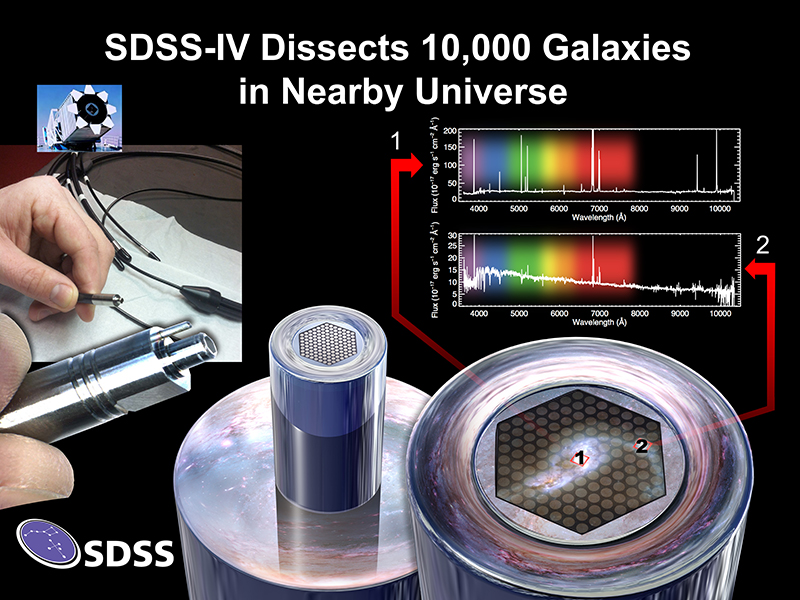
The answer lies in the light that we observe from the stars and the gas in galaxies. With images we capture the presence of light, but with spectrographs we unravel the light into different colours or wavelengths. The resulting galaxy spectra show us how the stars are moving around in the galaxy. In most galaxies, the stars will rotate around the centre of the galaxy, and this rotational velocity can be seen in the spectrum by a shift in the stellar absorption lines. This shift results from the Doppler Effect, which causes the lines of stars that move away from us to shift towards the red part of the spectrum, while the lines of stars that are moving towards us shift to the blue part of the spectrum. This way, we can find out how fast the stars in a galaxy are rotating around the galaxy centre. But there is more information in the spectrum: the lines are not infinitely thin, but are slightly broadened. This broadening is called ‘velocity dispersion’ and is caused by the additional random motions of the stars. With the new Sloan Survey, MaNGA, we are measuring the rotational and random motions of the stars in 10,000 galaxies. And because MaNGA is an integral-field spectrograph, we can map these motions not only in the very centre of the galaxies, but also in their outskirts, as shown below.

MaNGA is an integral-field spectrograph, capturing spectra at multiple points in the same galaxy with a fiber bundle. The bottom right illustrates how each fiber will observe a different section of the galaxy. The top right shows data gathered by two fibers observing two different part of the galaxy, showing how the spectrum of the central regions differs dramatically from outer regions. From these spectra, we measure the rotational and random motions of stars, to deduce how much dark matter is present in the galaxy. Image Credit: Dana Berry / SkyWorks Digital Inc., David Law, and the SDSS collaboration

How do these velocity and dispersion maps help us to find the dark matter? The answer is gravity. The stars are moving around in a galaxy under the influence of gravity: the more matter (mass) there is in the galaxy, the faster the stars are moving. Now that we have measured the movements of the stars in the galaxies, we can deduce how much matter is needed to have the stars move around with those measured velocities. And we can compare that gravitational mass with the luminous mass in the galaxy (the stars, gas and dust). For all galaxies studied so far, the gravitational mass is much larger than the luminous mass: hence the need for dark matter.

Example of a galaxy observed with MaNGA. Left is the image of the galaxy, showing the stellar light. The middle image is the rotational velocity field of the galaxy: the red part of the galaxy is moving away from us with 254 km/s, and the blue part of the galaxy is moving towards us with the same velocity. The green axis down the middle is the rotation axis. The right image shows the random motions of the stars: these are higher in the centre (red: 257 km/s) than in the outskirts of the galaxy (blue: 94 km/s). Figure taken from Bundy et al. 2015.

Example of a galaxy observed with MaNGA. Left is the image of the galaxy, showing the stellar light. The middle image is the rotational velocity field of the galaxy: the red part of the galaxy is moving away from us with 254 km/s, and the blue part of the galaxy is moving towards us with the same velocity. The green axis down the middle is the rotation axis. The right image shows the random motions of the stars: these are higher in the centre (red: 257 km/s) than in the outskirts of the galaxy (blue: 94 km/s). Figure taken from Bundy et al. 2015.

Sophisticated mass or dynamical models of the galaxies, based on the observed velocity and dispersion maps, tell us how the luminous and dark matter are distributed in the galaxy, and what the properties (mass, size, concentration) of the dark haloes are. Comparing these mass models with predictions from galaxy formation theories will help us forward in our quest to understand galaxies, and the dark haloes that surround them. But it all starts with capturing the stellar light of galaxies in spectrographs, to map the invisible.


This post was written by Dr. Anne-Marie Weijmans (St Andrews) and is part of the SDSS Celebration of the International Year of Light 2015, in which we aim to post an article a month about how SDSS uses light in our mission to study the Universe.

Heroes of the Helpdesk

They come in a steady stream: the requests for lost passwords, for aid in correcting a CasJobs query, for insight into the technical details of SDSS photometry, astrometry, and spectroscopy, for help with educational resources and SkyServer, and for general astronomical and database knowledge, all sent to helpdesk@sdss.org. Two or three times a day, they appear in the mailboxes of those on the helpdesk mailing list, representing the hopes and dreams of an astronomer, amateur, student, or professional, to use SDSS data to answer the big questions of the Universe (or at least to get more room on the server).

The helpdesk in action: Ben Weaver making SDSS science possible for yet another scientist.

The helpdesk in action: Ben Weaver making SDSS science possible for
yet another scientist.

The task falls to the volunteers, headed up and organized by Ben Weaver, Archive Scientist at New York University (right). Most questions are handled quickly by Ben, Ani Thakar, Archive Scientist at Johns Hopkins University, or Jordan Raddick, one of our Education Directors, also at Johns Hopkins. Promptness is easiest if the questioners have done us the kindness of including relevant information such as the context or URL they are using and the exact query. Occasionally questions about how parameters were derived or why there are changes between Data Releases requires the advice of other SDSS experts. In this case, Ben sends email to the relevant SDSS mailing list. Excellent answers are gratefully accepted from the wider collaboration, who really do know these data. Our thanks to everyone who has stepped up and contributed to making SDSS data scientifically valuable to an astonishing array of people. Above all, we wish to thank the helpdesk regulars. If you have sent an email to the helpdesk or if you know someone who has sent an email to the helpdesk (and you probably do, trust me), send a cheer their way.

Tweep of the Week: Sarah Jane Schmidt

In charge of the SDSS Twitter account for this week is Dr. Sarah Jane Schmidt, the Columbus Prize Postdoctoral Fellow in the Department of Astronomy at The Ohio State University

Dr. Sarah Jane Schmidt

Dr. Sarah Jane Schmidt

Dr. Schmidt studies the lowest mass and most numerous types of stars in our Galaxy – the M and L dwarfs. These types of cool stars have strong magnetic fields on their surfaces which results in special kinds of extra light from the stars, including dramatic flare events, which Dr. Schmidt works to observe and understand.

Within the SDSS collaboration, Dr. Schmidt has worked or is working on observing cool stars using spectroscopy from several different surveys:

1. A study of ultracool dwarfs with data from a BOSS (Baryon Oscillation Spectroscopic Survey) ancillary project

2. A TDSS (Time Domain Spectroscopic Survey) project looking at long timescale magnetic field variations on late-M and early-L dwarfs

3. Studying the colors of late-K and early-M dwarfs with measurements of temperature and metallicity from spectroscopic observations taken for the APOGEE survey.

This can all be summarised as spectroscopy of the lowest mass stars there are, and Sarah is most interested in using these to constrain the stars ages and how this relates to their magnetic activity.

We hope you’ll join the conversation with Sarah and other SDSS scientists on twitter this week so we can all learn more about the magnetic fields of the smallest stars in the Universe.

Spotlight on APOGEE: Jo Bovy and the Motion of the Sun

The spotlight this month is on Jo Bovy, a John Bahcall Fellow and Long-term Member at the Institute for Advanced Study in Princeton. He completed his PhD at New York University. Within APOGEE, he is the Science Working Group Chair for APOGEE-1, and therefore coordinates the scientific analysis of the APOGEE dataset.

bovy

Jo uses big datasets from numerous surveys to understand how the Milky Way came to be. To do this, he studies how stars move and what are their chemical compositions. When he first tackled APOGEE’s huge database of stellar spectra in 2011, he realized that APOGEE’s spatial coverage of the Milky Way’s disk allowed the circular velocity of stars in the Milky Way to be measured with greater accuracy than had ever been done before. (The circular velocity is the speed at which a star orbits the center of the Galaxy. This number changes as a function of distance from the center, and precise measurements are required to correctly determine, for instance, the Galaxy’s mass, but also to measure peculiarities in stellar velocity, which help us determine where it might have originated.) The data analysis in his paper is complex, but he was able to draw two important and straight forward conclusions from this work:

  1. that the circular velocity near the Sun (what we call the “solar neighborhood”), at a distance of 26,000 light-years from the center of the Galaxy, is 218 ± 6 km/s; and
  2. that the Sun itself is moving 25 km/s faster than other stars at the same distance.

The first result was expected: although the circular velocity in the Sun’s neighborhood was assumed to be about 220 km/s for the last 30 years or so, Jo’s was the first precise measurement to confirm this value. The second result, however, was a surprise: previous measurements had pegged the Sun’s motion relative to nearby stars at something like 12 km/s, not 25 km/s. This result was confirmed using a sub-set of APOGEE data (a mere 19,937 stars, or about 15% of the full APOGEE dataset) known as the APOGEE Red Clump Catalog.

Why does this seemingly small difference matter? From an outsider’s perspective, going from 12 km/s to 25 km/s is still only changing from about 5% to 10% of the circular speed, so either result might seem acceptable! But is is important, and Jo explains why: We orbit the Sun, and the Sun orbits the center of the Galaxy just like every other star. Therefore, every speed that we measure for another star is relative to our own motion. If we can understand how we move in the Galaxy, then we will have a much better understanding of the dynamics of the entire Milky Way.

And understanding the Milky Way is, after all, the whole point!

How SDSS Uses Light to Understand Stars Inside and Out in the Kepler Field

Stars are not only fascinating objects in their own right — they also help us understand the history of our Milky Way galaxy. Our galaxy was created as dark matter’s pull brought gas together, and the gas formed stars and planets. As part of the APOGEE survey, we wish to map the Milky Way’s star formation throughout cosmic time. As stars died, many of the elements they fused in their interiors during their lives or death throes are mixed back into the remaining gas, changing its composition and the composition of subsequent generations of stars and providing the raw materials for planets (and humans!) and we are exploring this chemical history as well.

A small part of the spectra of a few of the stars observed by APOGEE. The dark lines are caused by absorption of atoms in the star's atmosphere (or sometimes the Earth's). A few of them are highlighted. The bright lines are caused by emission in the Earth's atmosphere ("night sky lines") These particular stars have also been observed by the Kepler satellite.

A small part of the spectra of a few of the stars observed by APOGEE. The dark lines are caused by absorption of atoms in the star’s atmosphere (or sometimes the Earth’s). A few of them are highlighted. The bright lines are caused by emission in the Earth’s atmosphere (“night sky lines”) These particular stars have also been observed by the Kepler satellite.

APOGEE studies stars by passing their infrared light through gratings that spread the light out in wavelength (think infrared rainbows). We do this for > 250 stars at once (one of the reasons why the APOGEE instrument is fantastic). We can tell a lot about stars from studying these spectra. For example, in an earlier blog post, we discussed how we can tell the surface temperature of stars from such data. Another very important property is the composition of the star, for example, how many atoms of iron, calcium, or oxygen it has relative to hydrogen. The image to the left shows a small part of the spectra we gathered for stars that were also observed by the Kepler satellite. The stars do not give off the same amount of light at each wavelength (=color) of light. Instead, there are many dark lines, which are created when atoms in a star’s atmosphere absorb light at very particular wavelengths. Each element has a different pattern of these absorption lines, and by measuring the depth of these lines (+ additional information and math), we can determine the composition of the gas out of which the star formed.

But this doesn’t tell us everything about the star! In particular, we can’t see inside the star where the original composition of the gas is being transformed from hydrogen into helium as the star ages. We have a good idea of how long it takes for a star with a certain mass and original chemical composition to run out of fuse-able hydrogen in its center (about 10 billion years in the case of a star with the mass and composition of the Sun). When that happens, the star undergoes a dramatic change, turning into a red giant or supergiant. So if we can determine the mass to go with the spectral  composition information for red giants that we observe, we can determine the age of those particular stars.

Measuring the mass of a star is hard work, but one possible technique is to use asteroseismology, which is the study of the waves that move through stars. In the outer parts of stars, these waves are actually sound waves that can evocatively be described as ringing the star like a bell (For more information see The Song of the Stars). The motions of these waves cause a star’s brightness to change by small amounts, and thus the frequency of these waves can be measured by studying the lightcurves of red giant stars. The Kepler satellite, in addition to studying many Sun-like stars looking for transiting planets, also measured the brightnesses over many years of thousands of red giants. The favorite frequencies of waves in different stars have been measured by members of the Kepler Asteroseismic Science Consortium. While much can be learned about the insides of stars from these data, we are particularly intrigued by the fact that how long and at what speed waves can move through the star depends on the star’s density and therefore (with some more math) its mass!

Combining together spectra from APOGEE and lightcurves from Kepler therefore gives us a way to figure out the ages of red giant stars in our Galaxy by measuring the masses and composition of stars that have just exhausted their hydrogen. In conclusion, songs and rainbows are good things.

This post is part of the SDSS Celebration of the International Year of Light 2015, in which we aim to post an article a month about how SDSS uses light in our mission to study the Universe.