Wear the SDSS-III BOSS Data

The STEM inspired women’s fashion line “Shenova” has released it’s latest design – based on the final image of the SDSS-III BOSS catalogue. You can now wear this part of the SDSS!

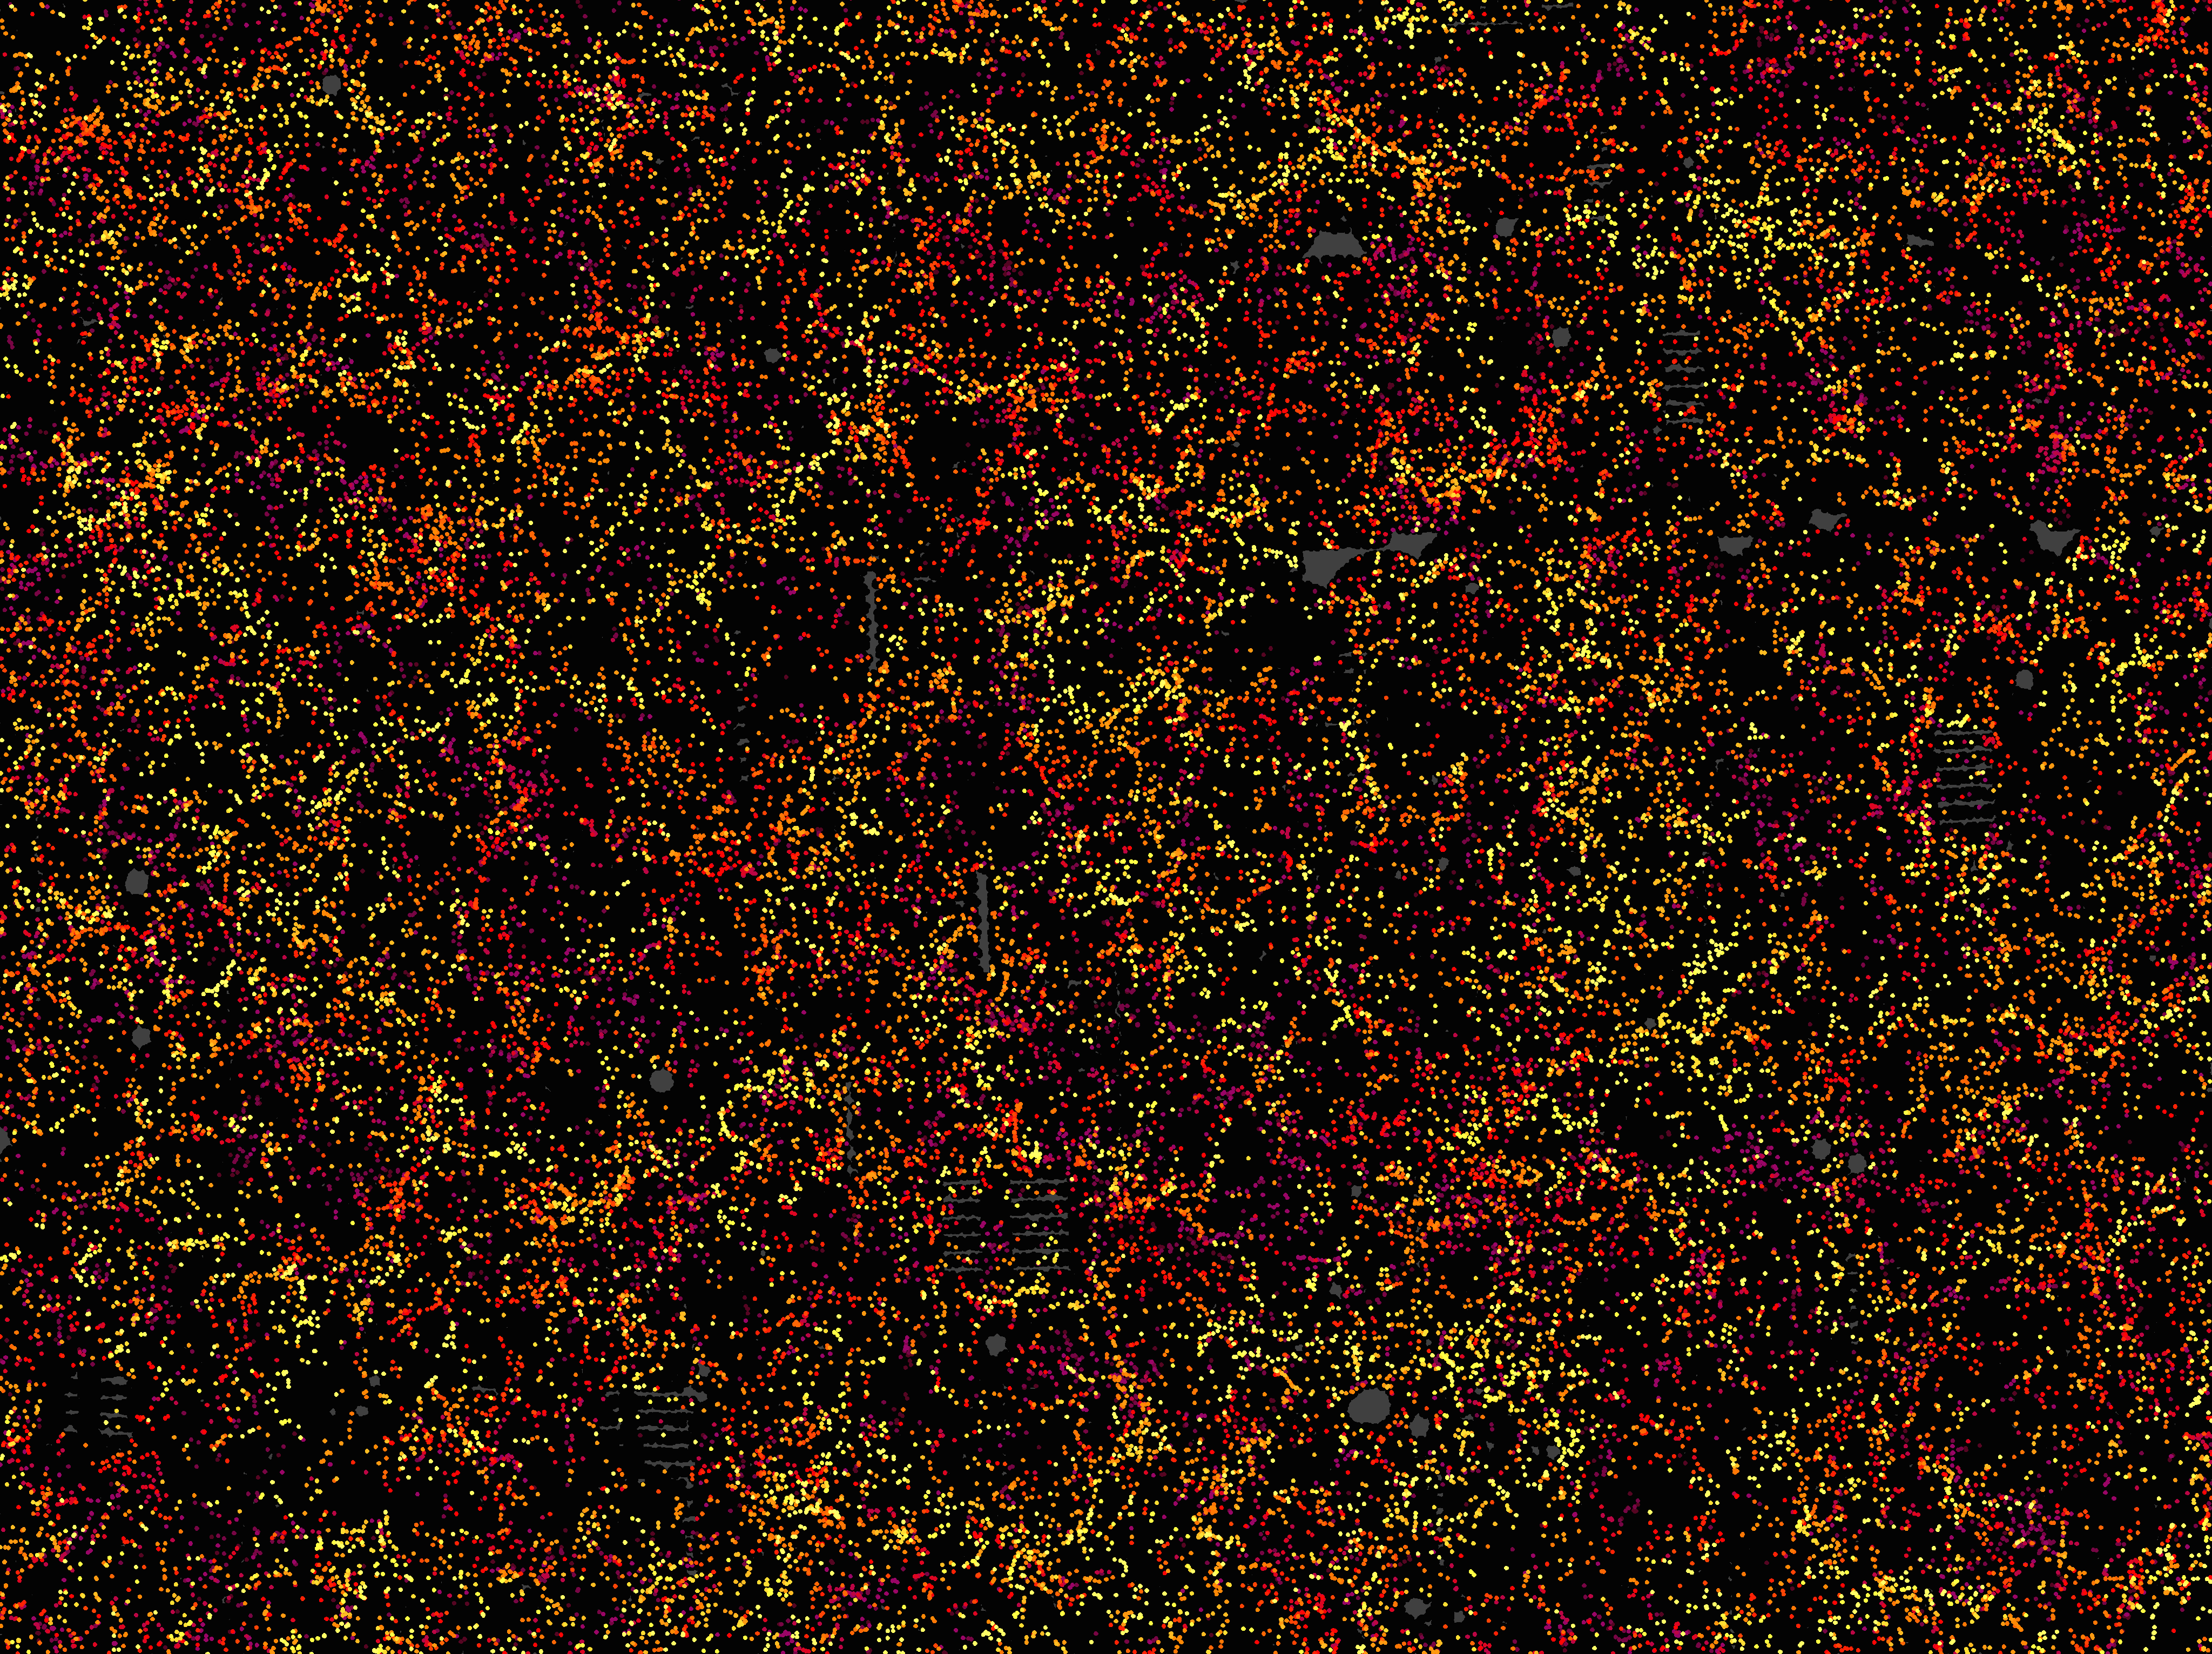
This is one slice through the map of the large-scale structure of the Universe from the Sloan Digital Sky Survey and its Baryon Oscillation Spectroscopic Survey. Each dot in this picture indicates the position of a galaxy 6 billion years into the past. The image covers about 1/20th of the sky, a slice of the Universe 6 billion light-years wide, 4.5 billion light-years high, and 500 million light-years thick. Color indicates distance from Earth, ranging from yellow on the near side of the slice to purple on the far side. Galaxies are highly clustered, revealing superclusters and voids whose presence is seeded in the first fraction of a second after the Big Bang. This image contains 48,741 galaxies, about 3% of the full survey dataset. Grey patches are small regions without survey data. Image credit: Daniel Eisenstein and the SDSS-III collaboration

As designed, Holly Renee describes, she added a colour gradient to the image on the dress to give it “distance and sparkle”. The dress is a turtleneck sheath style, but custom orders are also possible.

Screen Shot 2016-09-06 at 14.13.56

Check it out here: Shenova Online Store

Also worth a look is the Shenova Gravitational Wave Dress, which by coincidence is currently modeled on their front page by SDSS member, Prof. Kelly Holley-Bockelman from Vanderbilt University (the lead scientist for the SDSS Faculty and Student Team (FAST) initiative) as she gave a recent TEDx talk on her research work: “The Spacetime Symphony of Gravitational Waves“.

Screen Shot 2016-09-06 at 14.07.35

(Please note that SDSS receives no funds from the sale of either of these dresses, we just think they’re awesome celebrations of science and women’s fashion).

How SDSS Splits Light into a Rainbow for Science

All of the Sloan Digital Sky Surveys currently active (APOGEE, eBOSS, MaNGA, Spider and TDSS) are spectroscopic surveys. A spectroscope is a scientific instrument, which splits light into a rainbow (or spectrum) in order to make precise measurements of the amount of light of different colours (or wavelengths). To date the SDSS collaborations have used three different spectroscopes (the SDSS, BOSS and APOGEE instruments) to measure the rainbow of light from millions of stars and galaxies in our mission to map the Universe. Below is an image of one of these spectrographs.


boss_spectrograph

The BOSS Spectrograph. In centre the instrument is shown with optical fibres plugged into it. The diagrams at the side show the path of the light through the instrument after it passes down the fibre. Different parts are labelled.This instrument you have made has many similarities to the BOSS spectroscope shown above.

It is possible to make your own spectroscope using simple household materials and use it to measure the spectra of common light sources.  Here are instructions to build an SDSS CD Spectropscope. This instrument you can make has many similarities to the BOSS spectroscope shown above. For example:

  1. You will construct a slit through which the light will pass. In the diagram of the BOSS spectroscope this is labeled “slit-head”, and the light from the optical fibres is collected, “collimated” (i.e. lined up) and passes though it.
  2. You will use an old CD to make a grating (the BOSS spectroscope has 4 gratings; 2 on each side, and sandwiched between prisms to make a “grism”). A typical CD is made with 625 lines per mm. The the BOSS spectrograph has 520 and 400 lines/mm for the blue and red sides respectively.

Your spectroscope will be sensitive to all visible light. In the BOSS spectroscope a “dichroic” is used to split the light into red and blue before passing it through the gratings. A dichroic has a special property that it is reflective to blue light, while red light passes through it. This means the light can be spread out more, and special cameras can be used to detect light from near ultraviolet, right across the visible rainbow to the near infrared.

Instead of a camera you will use your eye (or you could try using a camera lined up with the viewing window). In the BOSS spectroscope there are four cameras (two for blue and two for red light) each kept specially cold in a “dewer”.

When the light passes through the slit it gets spread out a little bit, and then when it passes through the CD, the very fine slits in it (the diffraction grating) spread it out more. Different colours are spread out (or “dispersed”) by different amounts. The angle of dispersion is set by both the wavelength (colour) of the light, and the line spacing on the diffraction grating. The below image illustrates this (compared to refraction which can also create spectra; this is the physics which creates natural rainbows from refraction in raindrops). The diffraction angle increases with wavelength (and decreases with the line spacing).

Comparison of the spectra obtained from a diffraction grating by diffraction (1), and a prism by refraction (2). Longer wavelengths (red) are diffracted more, but refracted less than shorter wavelengths (violet).Credit: Wikimedia

Comparison of the spectra obtained from a diffraction grating by diffraction (1), and a prism by refraction (2). Longer wavelengths (red) are diffracted more, but refracted less than shorter wavelengths (violet).Credit: Wikimedia

Here are some examples of the kind of spectra you should be able to take with your CD spectroscope.

Example spectra through a CD spectroscope. Credit: CoolStuff Newsletter

Example spectra through a CD spectroscope. Credit: CoolStuff Newsletter

To make precise measurements we don’t tend to look at a pretty image of a rainbow, but instead make a graph which shows the brightness as a function of the wavelength (colour). An example of this is shown below which is a typical spectrum of a galaxy shown at five different distances (or redshifts).

redshift

The spectrum of a galaxy shown at five different distances (or redshifts), z=(0.0, 0.05, 0.10, 0.15, 0.20) corresponding to distances of (6, 12, 18 and 21 hundred million light years). Credit: SDSS Skyserver

If you do make an SDSS CD Spectroscope please take a picture (either of it or through it) and share it with us on Twitter or Facebook.


This post is part of the SDSS Celebration of the International Year of Light 2015, in which we aim to post an article a month about how SDSS uses light in our mission to study the Universe. 

How SDSS Used Light to Make the Largest Ever Image of the Night Sky

The Sloan Digital Sky Survey imaged over 30% of the sky between the years of 1998-2008, creating the largest digital colour image of the sky ever taken. To view all of the SDSS imaging at once, would require 500,000 HD televisions (so it can be displayed at full resolution), and with more than a trillion pixels, this image dwarfs the 1.5 billion pixel image that NASA recently claimed was the biggest ever taken.

The SDSS Camera which took all of this imaging is now retired, and was collected by the Smithsonian Institution, to be packed away in a basement as an “artifact of scientific significance”.

The SDSS Camera in its current home - a basement of the Smithsonian Museum in Washington, D.C. Image Credit: Xavier Poultney, SDSS.

The SDSS Camera in its current home – a basement of the Smithsonian Museum in Washington, D.C. Image Credit: Xavier Poultney, SDSS.

The SDSS camera was made by arranging together an array of thirty, 2048×2048 pixel CCD chips. In the 1990s this was state-of-the-art, and even today a 126 Megapixel camera is nothing to sniff at (e.g the current state-of-the-art is DECam which has 62 CCDs and a total of 520 Megapixels).

The CCD chips in the SDSS camera were aligned in five columns, each covered by one of the five filters used to make the colour imaging (the u-, g-, r-, i- and z-bands, roughly corresponding to collecting light in the near-ultraviolet, green, red, near-infrared and a bit less near-infrared respectively).

faceplat2

An illustration of the arrangement of the CCDs and filters on the camera. The filters from top to bottom are r, i, u, z and g-band. Image credit: SDSS.

This arrangement meant that the camera could take images continuously as the Earth rotated and moved it with respect to the sky overhead. SDSS images are therefore arranged in long stripes of constant Declination across the sky (the most famous being “Stripe 82” which was imaged many times). You can make out some of these stripes around the edges of the stitched together image (the “legs of the orange spider” below).

Orange Spider! This illustration shows the SDSS imaging on many scales. The picture in the top left shows the SDSS view of a small part of the sky, centered on the galaxy Messier 33 (M33). The middle and right top pictures are further zoom-ins on M33. The figure at the bottom is a map of the whole sky derived from the SDSS image. Visible in the map are the clusters and walls of galaxies that are the largest structures in the entire universe. Figure credit: M. Blanton and SDSS

All SDSS imaging is publicly available and can be explored online via the SDSS Skyserver. The Navigate Tool is especially fun as you can scroll around the entire image.

A much more technical description of the camera can be found in Gunn et al. (1998) and in the SDSS-I project book.


This post is part of the SDSS Celebration of the International Year of Light 2015, in which we aim to post an article a month about how SDSS uses light in our mission to study the Universe. 

David Schlegel Wins an Ernest Lawrence Award

Prof. David Schlegel of Lawrence Berkeley National Laboratory, the PI of the BOSS part of SDSS-III and a long time contributor to all areas of the Sloan Digital Sky Surveys was announced yesterday as one of the winners of the E.O. Lawrence Award.

David Schelegel, PI of BOSS, shows off a plug plate. Image credit: LBL

David Schelegel, PI of BOSS, shows off a plug plate. Image credit: LBL

The Ernest Orlando Lawrence Award was established in 1959 in honor of Ernest Lawrence, who invented the cyclotron (for which he won 1939 Nobel Laureate in physics). The Lawrence Award honors U.S. scientists and engineers, at mid-career, for exceptional contributions in research and development supporting the Department of Energy and its mission to advance the national, economic and energy security of the United States.

The citation for David’s award (for the High Energy Physics Category of the award) reads:

Honored for his exceptional leadership of major projects making the largest two-dimensional and three-dimensional maps of the universe, which have been used to map the expansion rate of the Universe to 10 billion light years and beyond. His fundamental technical contributions to high precision measurements of the expansion history of the Universe, and his massive galaxy redshift surveys to detect baryon acoustic oscillations, has helped ascertain the nature of Dark Energy, test General Relativity, and positively impact fundamental understanding of matter and energy in the universe.  These efforts have made precision cosmology one of the most important new tools of high-energy physics.

All of us at SDSS are delighted to wish David Schlegel many congratulations for this honor.

Tweep of the Week: Sarah Jane Schmidt

In charge of the SDSS Twitter account for this week is Dr. Sarah Jane Schmidt, the Columbus Prize Postdoctoral Fellow in the Department of Astronomy at The Ohio State University

Dr. Sarah Jane Schmidt

Dr. Sarah Jane Schmidt

Dr. Schmidt studies the lowest mass and most numerous types of stars in our Galaxy – the M and L dwarfs. These types of cool stars have strong magnetic fields on their surfaces which results in special kinds of extra light from the stars, including dramatic flare events, which Dr. Schmidt works to observe and understand.

Within the SDSS collaboration, Dr. Schmidt has worked or is working on observing cool stars using spectroscopy from several different surveys:

1. A study of ultracool dwarfs with data from a BOSS (Baryon Oscillation Spectroscopic Survey) ancillary project

2. A TDSS (Time Domain Spectroscopic Survey) project looking at long timescale magnetic field variations on late-M and early-L dwarfs

3. Studying the colors of late-K and early-M dwarfs with measurements of temperature and metallicity from spectroscopic observations taken for the APOGEE survey.

This can all be summarised as spectroscopy of the lowest mass stars there are, and Sarah is most interested in using these to constrain the stars ages and how this relates to their magnetic activity.

We hope you’ll join the conversation with Sarah and other SDSS scientists on twitter this week so we can all learn more about the magnetic fields of the smallest stars in the Universe.

SDSS Tweep of the Week: Qingqing Mao

This week’s tweeter is Qingqing Mao, a graduate student at Vanderbilt University.
Qingqing has a wide range of research interests spanning from the structure of our Milky Way to the very large-scale structure of our universe. He has used both SEGUE and BOSS data for his research. Currently his main project is looking at how to identify cosmic voids – which are large underdense regions with very few galaxies – in BOSS data and use them to study cosmology.
Qingqing Mao

Qingqing Mao

Qingqing also participates in SDSS EPO, especially including social network activities and multilingual efforts. He leads our efforts to keep the SDSS Chinese facebook page and SDSS Chinese Weibo updated.
Qingqing has also developed an astronomy iPhone ap, which allows users to explore data of the Cosmic Microwave Background: CMB Maps.
He regularly tweets as @maoqingqing and his personal website can be found at http://mqq.io/.

BOSS Completes its Main Survey of Distant Galaxies and Quasars!

The SDSS-III Baryon Oscillation Spectroscopic Survey (BOSS) has completed its main survey of galaxies and quasars. With 1.35 million luminous red galaxies and 230,000 quasars across 10,200 square degrees of the sky, BOSS has exceeded the number of objects and sky area goals from the original SDSS-III proposal.

Reaching this milestone involved the hard work and efforts of many people. In particular, the mountain and observing staff at Apache Point Observatory have been worked hard and efficiently to observe 2,300 plates with the new BOSS spectrograph in 4.5 years of dark time.

survey_mollweide_DR12

The coverage map of the completed BOSS main survey in equatorial coordinates with (RA, Dec)=(90,0) in the center of the image. Completed areas are shown in light blue and yellow. The red area is a 10,500 deg^2 region from which observations were selected. The project goal was to observe the 10,000 deg^2 footprint above declination -3 deg. A 200 deg^2 region was added between declinations of -3 deg to -7 deg to provide overlap with the Dark Energy Survey.

For the remaining 3 months of SDSS-III, the BOSS spectrograph continues to observe new interesting classes of objects as part of a set of ancillary proposals that were internally competed within the SDSS-III collaboration.

All of SDSS-I, SDSS-II, and SDSS-III/SEGUE observed 1.84 million survey-quality spectra with the original SDSS spectrograph during the timeframe 1999-2009. SDSS-III DR12 will be released publicly in 2014 December and the final BOSS data in DR12 is expected to exceed 2.7 million survey-quality spectra, including calibration targets, stars, repeated observations, and ancillary programs.

The Most Precise Measurement Yet of the Expanding Universe

More exciting news from the SDSS! A worldwide team of SDSS astronomers has completed the most precise measurement of the expanding universe ever. The result was announced just hours ago at the meeting of the American Physical Society in Savannah, Georgia.

Click on the illustration below to go to the SDSS press release describing this exciting news!


Yellow lines showing light paths pass through circles of increasing size. Each              circle shows in purple the structure of galaxies in the universe at some point in the past.

An illustration of how astronomers used quasar light to trace the expansion of the universe.