Writing with Galaxies

Steven Bamford has taken the publically available SDSS image data and a fun shape-identification project from Galaxy Zoo to provide a web page to write with the galaxies in the cosmos:

http://mygalaxies.co.uk/

After writing your word or phrase, click through to see the actual detailed data
on each galaxy as gathered by SDSS.

This is currently limited to the letters, numerals, and common punctuation marks in standard English writing. Internationalizations could follow if someone wanted to classify character shapes in other alphabets.

APOGEE in the News: On-Air and Online

APOGEE On-Air:
For an introduction to APOGEE, take an hour to listen to this interview on WMRA radio’s Virginia Insight featuring APOGEE PI Steve Majewski, Gail Zasowski, and John Wilson.

http://wmra.org/post/discovering-stars-whole-new-way

APOGEE + Kepler Collaboration Highlighted in New Scientist:
The New Scientist reports in its April 2012 issue (subscription required) on searches for stars formed along with our Sun. The article highlights the SDSS-III APOGEE experiment and the new collaboration between SDSS-III and the Kepler asteroseismology team to jointly study stars in the Milky Way. The New Scientist article explains that while APOGEE

is not looking explicitly for the sun’s siblings, “it’s very possible that these stars will be in the sample”, says Steven Majewski of the University of Virginia in Charlottesville. One advantage of APOGEE is that 10 per cent of the stars it surveys are shared by NASA’s Kepler spacecraft, whose observations of flickering starlight will tell us the ages of these stars. This is crucial, says Majewski, because any solar sibling must be the same age as the sun, as well as share its chemical composition and motion.
(New Scientist, 2012 April 7, pp 40-41, “The sun’s sibilings” by Ken Croswell)

Kepler is a space satellite observing 100,000 stars in our Milky Way galaxy to look for planets around Sun-like stars. Its photometric observations are so precise that it can detect the pulsations of distant stars as they resonate with sound waves, much like the many frequencies of vibration in a ringing bell. The science of studying these pulsations is called asteroseismology.


Image: APOGEE’s targets include star clusters like M67 that have an elemental composition very similar to that of the Sun. This image illustrates the APOGEE spectrum (the blue line in the lower part of the image) of just one of the hundreds of stars APOGEE can observe at one time. By studying M67 and other clusters APOGEE will provide insights into the conditions in which our Sun was born.
Image Credit: Peter Frichaboy (TCU), Robert Lupton (Princeton), and the SDSS collaboration.

The Kepler observations reveal the many frequencies of oscillation of individual stars, data that can be used to determine very precisely the radii and masses of these stars. In principle, the stellar radii and masses can be used to determine very precisely the evolutionary state — and, therefore, the age — of each star, but there remains some uncertainty if the chemical composition of the star is unknown. Thus the APOGEE team and Kepler seismologists are now collaborating on a program to use APOGEE spectroscopy to uncover the chemical compositions of a sample of about 10,000 Kepler asteroseismology targets and to create the largest sample of Milky Way field stars with known ages. In addition to providing a set of very well studied stars for understanding the evolution of the Milky Way, the combined data set will improve the calibration of science done with all of the stars in each project.

SDSS-III Documentation Fiesta for DR9

A core team of SDSS-III members is meeting this week at NYU to write the documentation for SDSS-III Data Release 9, scheduled for July 2012. This release willpresent the first spectra from the BOSS survey of galaxies and quasars.

One of the key aspects of each data release has been providing as much information as we can about every aspect of the data. Astronomers around the world continue to do new and inventive things with SDSS-III data, and the project strives to do its best to document the properties and caveats of the data to support such great new science.


Team members try to balance tedium and fun. Delegation appears to be an effective strategy. Here we rely on Jeremy Tinker (left), in charge of target tiling, and Ben Weaver (right), in charge of managing all of the bits of SDSS-III data, to do some of the heavy lifting. While the group currently meeting is leading much of the effort, the documentation for each data release represents the culmination of the work of many, many engineers and scientists across the entire collaboration.
(Image Credit: Michael Wood-Vasey)

A new BOSS record: 103,000 spectra in a month!

The Apache Point Observatory operations team reached a new record, observing 103 BOSS plates in March of 2012.

BOSS observes 1000 spectra at a time, organized by “plug plates” whose holes precisely align fiber optic cables that route light from the telescope focal plane to the spectrographs. Each plate has 1000 fibers, 10% of which are dedicated to the sky calibration, so ~90,000 spectra of astronomical objects were taken during this time.

This is the most number of spectra that any astronomical survey has ever observed in a month. In fact, no survey on any telescope other than the Sloan 2.5-m and the Anglo-Australian Telescope have ever even published more spectra than this one-month haul from SDSS-III.

Typically BOSS observes 50-60 plates per month. This March had unusually good weather enabling faster observations, even as the Spring nights are getting shorter and shorter. The entire Apache Point Observatory (APO) staff worked hard and with the utmost efficiency to keep up, resulting in a record breaking 103 plates this month in only 16 nights of active BOSS observing (the other nights went to APOGEE or were lost to bad weather), including the first ever “perfect night” of 9 plates from start to finish (we don’t have a 10th cart to mount another plate).

Congratulations to the entire APO staff!


Image Caption: In March, BOSS observed 103,000 spectra, each of which was routed through a fiber-optic cable that was plugged by hand. The industrious APO plugging crew is pictured here showing the deleterious effects of having placed more than 2,000 fibers/finger in a month. But don’t worry, click through to see that they’ve recovered and are happy to face a new month of plugging. (Image Credit: Dan Long, APO).

The Beginning of Dark Energy

The Sloan Digital Sky Survey (SDSS-III) today announced the most accurate measurements yet of the distances to galaxies in the faraway universe, giving an unprecedented look at the time when the universe first began to expand at an ever-increasing rate. The results, announced today in six related papers posted to the arXiv preprint server, are the culmination of more than two years of work by the team of scientists and engineers behind the Baryon Oscillation Spectroscopic Survey (BOSS), one of the SDSS-III’s four component surveys.


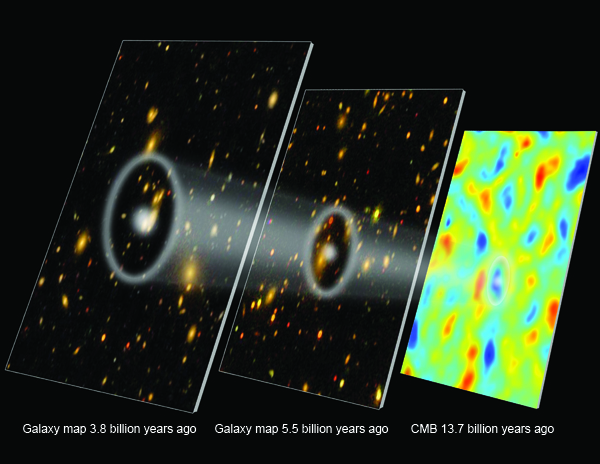
The record of baryon acoustic oscillations (white rings) in galaxy maps helps astronomers retrace the history of the expanding universe. Figure Credit: E.M. Huff, the SDSS-III team, and the South Pole Telescope team.
Graphic by Zosia Rostomian.

BOSS scientists announced these results today at the National Astronomy Meeting (NAM) in the UK and will present them at the American Physical Society (APS) meeting in the US on Sunday. These new results provide the best measurements yet that directly compare the distance to galaxies 6 billion years ago and the cosmic microwave background from 13.7 billion years ago. This measurement is thus a key part of determining the nature of dark energy that is currently accelerating the expansion of the Universe. The BOSS results focus on the era when dark energy first emerged as a significant player in the Universe. By understanding how it began to dominate the Universe’s expansion, SDSS-III scientists hope to be able to reveal more about this mysterious substance that makes up 70% of the mass-energy of the Universe.

For more information and reference to the papers, see the SDSS-III press release at

http://www.sdss3.org/press/20120330.bspec.php

Newly Developed Astrophotonics Calibration Source Tested with APOGEE

One of the most important things scientists need to know when using a spectrograph is precisely how light from different objects and different wavelengths travels through the instrument, and how the instrument changes and moves over the course of a survey. A new device developed at Penn State University adapts techniques from the fiber-optic telecommunications industry to demonstrate a very accurate and precise calibration of the SDSS-III APOGEE spectrograph.


The image shows the three APOGEE camera arrays illuminated with the output from the Fabry-Perot calibration device. The 200nm wavelength range of APOGEE is divided up into three different cameras. The light from each fiber is spread out across a row in this image. When APOGEE is observing the night sky, each row would be the light from a star. If you zoom in on the image you can see the large number of individual peaks that SDSS-III scientists can use to map out all of the details of the APOGEE instrument. (While the APOGEE instrument detects infrared light, we have represented the light in visual wavelengths so that you can see it.)

APOGEE currently uses thorium-argon and uranium-neon lamps for wavelength calibration. These lamps heat up small quantities of their respect elements; the elements in turn emit this energy at specific wavelengths characteristic of those elements. However, the number of lines available is fixed to the properties of the actual elements. Thorium-Argon lamps are commonly used in optical spectroscopy, but don’t have nearly enough bright lines in the near-infrared part of the spectrum to provide a good calibration. Uranium has plenty of lines in the near infrared, but they tend to blend together unless one uses a very high resolution spectrograph. Luckily, the telecommunications industry has developed efficient fibers and light sources in the near-infrared that can be adapted to some of these needs. The near-infrared sensitivity of the APOGEE instrument overlaps some of the standard telecom bands, making it possible to adapt and modify existing technology for use as calibration devices.

A team of scientists and engineers from several SDSS-III institutions recently tested out such a prototype test an entirely new way of calibrating APOGEE. The team brought together experts from several SDSS-III institutions, comprising Suvrath Mahadevan, Sam Halverson (Penn State), Fred Hearty, John Wilson (UVa), Jon Holtzman (NMSU), and Dimitry Bizyaev (APO). Using a Fabry-Perot interferometric cavity, the team was able to generate a precisely-controlled light source that had a stable fixed pattern of peaks. During a three-day run in February this calibration device was tested on the actual APOGEE instrument with great success. The new device, build entirely with commercially available components, consists of a single-mode fiber Fabry-Perot cavity illuminated with a supercontinuum source, and kept very stable with a thermoelectric temperature controller. The output of the cavity results in 400 emission peaks in the APOGEE wavelength regime. This light is fed to APOGEE’s 300 fibers and then passes through the volume-phase holographic grating that disperses the light to separate out different wavelengths onto different places on the camera. In the end, 400 emission peaks times 300 fibers results in 120,000 clearly-defined peaks in the APOGEE focal plane!. These peaks help astronomers to map out many of the important properties of the instrument: the line-spread function, scattered light, persistence effects, point-spread function, as well as providing a grid of stable markers across the focal plane to enable detailed tracking of any overall instrument drift.

The new calibration device is relatively insensitive to vibration and atmospheric pressure changes, and the single mode fiber mitigates issues of collimation and alignment that often affect larger Fabry Perot devices. Ongoing analysis of the dataset acquired over the three-day test is expected to help calibrate many aspects of the APOGEE instrument, including the mosaic Volume Phase Holographic grating at the heart of the APOGEE spectrograph.

ACT and BOSS collaborate for the first detection of the kinetic Sunyaev-Zel’dovich effect

A joint analysis of data from the Atacama Cosmology Telescope and the SDSS-III Baryon Oscillation Spectroscopic Survey (BOSS) has yielded the first robust detection of the kinetic Sunyaev-Zel’dovich effect, first predicted forty years ago. This effect is due to the motions of galaxy clusters with respect to the cosmic microwave background, and its imprint will unveil new information about dark energy, dark matter, and the formation of the galaxy clusters—the largest bound structures in the Universe.

For more, see the joint press releases from the ACT and SDSS-III collaborations:

http://www.princeton.edu/main/news/archive/S33/21/69O40/
http://www.sdss3.org/press/20120319.ksz.php

The paper was posted to the arXiv preprint server today as

“Detection of Galaxy Cluster Motions with the Kinematic Sunyaev-Zel’dovich Effect”
http://arxiv.org/abs/1203.4219

Colliding Stars May Spark Astronomical Fireworks

A key part of the impact of SDSS has been the use of data by scientists outside of the project itself. Recent results from the public data released last year as Data Release 8 find that there are enough merging white dwarfs in our galaxy to explain the observed rate of Type Ia supernovae.

In a paper accepted today to the Astrophysical Journal Letters, “The Merger Rate of Binary White Dwarfs in the Galactic Disk”, astronomers Carles Badenes (University of Pittsburgh) and Dan Maoz (Tel-Aviv University) used the individual sub-exposures from SDSS spectra to analyze spectra of white dwarfs at different times to statistically determine the number of binary white dwarf systems in our region of the Milky Way. They found that the number of binary white dwarf systems is enough to explain the one Type Ia supernova every 100 years that occurs in a galaxy like our own.

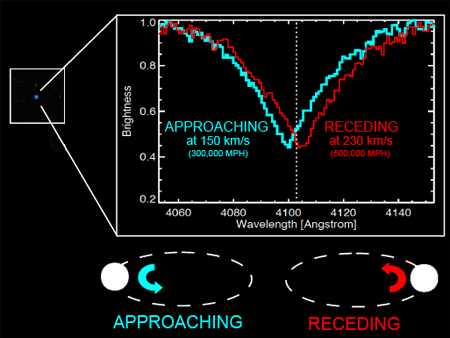
Doppler Shifted Spectrum of Binary White Dwarf System
(Image Credit: Carles Badenes and the SDSS-III team)

Some ordinary-looking faint blue star (left) is actually a pair of white dwarfs, stars nearly as massive as our sun but compressed by gravity to a density that is a million times higher. The analysis of SDSS data by Badenes and his team shows that white dwarf pairs are common enough that their collisions, induced by the emission of gravitational waves, can explain the important class of cosmic explosions known as “Type Ia supernovae.”

An SDSS spectrum usually detects light from just the brighter of the two white dwarfs. But we can learn of the presence of the fainter companion, and the future of both stars, from measuring multiple spectra of the star we can see. As the white dwarf orbits its unseen companion, it sometimes approaches us (blue in the drawing at the bottom) and sometimes recedes from us (red).

For more details see the SDSS-III press release
http://www.sdss3.org/press/20120227.fireworks.php
or the write-up in Ars Technica.

There is also a companion paper that gives more of the in-depth technical details:
“Characterizing the Galactic White Dwarf Binary Population with Sparsely Sampled Radial Velocity Data”
Dan Maoz, Carles Badenes, Steven J. Bickerton
http://arxiv.org/abs/1202.5467

Back to the Future: Cosmic distance measurements just got better!

Driven by a mysterious dark energy, the expansion of the Universe is accelerating. This increased rate of expansion is one of the most puzzling issues in astronomy in the last two decades. The most promising way to understand the nature of dark energy is to measure the expansion history of the Universe by determining distances to when the Universe was younger. To measure these distances, the Universe provides us with a cosmic yardstick, 500 million light years long, known as baryon acoustic oscillations (BAO). These are sound waves formed in the very early Universe, whose wavelength has been imprinted in the distribution of galaxies. By measuring the BAO on the sky at various cosmic epochs we are measuring the distance to those epochs and therefore mapping the expansion history of the Universe.

The SDSS survey used a sample of luminous red galaxies to detect for the first time the presence of the BAO and measure its angular extent on the sky. The specific size of the BAO is imprinted in the separation of the overdense regions of the Universe in Figure 1. As the Universe evolves with time, these overdense regions will form galaxies. However, the positions of the galaxies are distorted by gravitational interactions between the large overdensities over time as shown in Figure 2. In order to accurately measure the BAO extent at different epochs, we would need to measure the undistorted positions of the galaxies, washed away by gravity.


In a recent series of three papers, a team of SDSS astronomers has applied for the first time a novel technique to estimate the displacement of each galaxy due to gravitational effects, shown as blue arrows in Figure 3. Subtracting these displacements effectively moves the galaxies back in time, thereby undoing a majority of the gravitational distortions and reconstructing the original matter distribution in Figure 4. This reconstruction technique sharpens the focus on our standard ruler and increases the precision of cosmic distance measurements. These results will pave the way for even more precise measurements from the Baryon Oscillation Spectroscopic Survey.


More details can be found at:
http://www.astro.yale.edu/padmanabhan/dr7recon/

The three papers submitted to Monthly Notices of the Royal Astronomical Society are available at:

http://arxiv.org/abs/1202.0090 (Padmanabhan et al. 2012 – Methods and application to SDSS)
http://arxiv.org/abs/1202.0091 (Xu et al. 2012 – Fitting techniques)
http://arxiv.org/abs/1202.0092 (Mehta et al. 2012 – Cosmological measurements and interpretation)

BOSS Survey Reaches 50% Complete with 860,000 galaxies, quasars, and stars

The SDSS-III BOSS survey is now 50% complete. BOSS Survey Scientist Kyle Dawson and Principal Investigator David Schlegel report that as of January 31, 2012 BOSS has completed 1106 survey-quality plates out of its target goal of 2212 plates by summer 2014. Each plate contains holes matching 1000 targets on the sky. 64% of these targets are galaxies, 11% are quasars, 11% are stars, 10% of these targets are observations of blank sky used for calibration, while 3% were targeted as galaxies, quasars, or stars but we didn’t get sufficient signal to classify them. Completing 1106 plates means that BOSS now has collected spectra of 860,000 astrophysical objects including:

642,000 galaxies
110,000 quasars
108,000 stars
  30,000 objects without secure classifications

This puts BOSS slightly ahead of schedule, largely thanks to the very hard work of the entire observing team, and a bit of luck from some slightly darker skies associated with solar minimum.

A noticeable part of the brightness of the night sky emission comes from emission high in the Earth’s atmosphere that is excited by extreme-ultraviolet (EUV) emission from the Sun. The strength of the solar EUV emission follows with the general solar cycle. Thus the sky brightness of the Earth’s atmosphere shows similar variations, which can be as much as 50% of the sky brightness at a dark site.

But closer to cities, the sky brightness is completely dominated by the glow from city lights, which is why the stars of the Milky Way aren’t visible to most people living in the developed and urbanized world. Increasing light pollution from cities is one of the reasons astronomers are forced to place observatories in increasingly remote locations.

BOSS Imaging Cosmology Results at AAS

Thousands of astronomers are gathered in Austin, Texas this week for their annual winter meeting in the US. At a special session held this afternoon, SDSS-III scientists presented cosmological results from BOSS imaging data and provided hints of the power of the spectroscopic data to come in a few months.

BOSS Imaging Cosmology Press Release

David Kirkby (UC Irvine) provided a nice visualization of the 900,000 galaxies that were used to measure structure in the Universe to teach us more about the nature of dark matter, dark energy, and neutrinos in the Universe:


AAS Joint SEGUE-2 and APOGEE Press Conference

Today at the 219th meeting of the American Astronomical Society, SDSS-III astronomers presented new evidence probing the history of the disk of our galaxy from SEGUE-2 and the first peak at science from impressive new APOGEE instrument.

For more details see the press releases at:

SEGUE-2 Press Release

APOGEE Press Release

which include the following figures highlighting the results:


APOGEE:
The agove figure shows the “first-light” field of stars observed by APOGEE. This field is filled with Milky Way stars, star clusters and dust (seen as colored, glowing clouds in this image from NASA’s WISE infrared observatory). The large white circle is the field of view of APOGEE, with a width spanning six moon diameters. The green circles indicate known or suspected young star clusters. The small red circles indicate the position of each faint star targeted with APOGEE’s fiber optic system. The inset shows pieces of the APOGEE spectra for stars determined by APOGEE to be members of two of the clusters shown. These members were identified by the near identical motions through the galaxy shared by each clusters’ stars. The motions are detected as shifts of the spectral features caused by the Doppler effect. These dark line features are caused by absorption of specific colors of light by the atoms of the different chemical elements in each star. Figure Credit: P. Frinchaboy (Texas Christian University), J. Holtzman (New Mexico State University), M. Skrutskie (University of Virginia), G. Zasowski (University of Virginia), NASA, JPL-Caltech and the WISE Team.


SEGUE-2:


The above figure highlights the measurements of the metal content of stars in the disk of our Galaxy, using stars observed by SDSS-III’s SEGUE-2 survey. Horizontal lines describe where SEGUE data measure the chemical composition of stars near and above the plane of the disk. The bottom panel shows the decrease in metal content as the distance from the Galactic center increases for stars near the plane of the Milky Way disk. In contrast, the metal content for stars far above the plane, shown in the upper panel, is nearly constant at all distances from the center of the Galaxy. The image of the Milky Way is from the Two-Micron All Sky Survey. Figure Credit: Judy Cheng and Connie Rockosi (University of California, Santa Cruz) and the 2MASS Survey.

SDSS-III finds a large population of massive galaxies making stars 5 billion years ago

Building on the legacy of the Sloan Digital Sky Survey (SDSS), the SDSS-III’s Baryon Oscillation Spectroscopic Survey (BOSS) is currently mapping the spatial distribution of the most massive galaxies in the Universe. SDSS-III astronomers have been using the galaxy spectra obtained by these experiments to infer important physical information about the stars and the gas in these systems, which illuminate how galaxies formed and evolved over the history of the Universe.

In a recent paper, BOSS scientists from the University of Wisconsin, the Max Planck Institute for Astrophysics, Johns Hopkins University, along with other members of the SDSS-III team, studied the masses and ages of around 300,000 massive galaxies at redshifts ranging from 0.45 to 0.7, corresponding to a time when the Universe was 60 percent of its present age of 13.7 billion years. These galaxies all have stellar masses larger than 100 billion times that mass of our Sun (10^11 Msun), making this the largest sample of massive galaxies with spectra to have been analyzed thus far.

“Evolution of the Most Massive Galaxies to z=0.6: I. A New Method for Physical Parameter Estimation”
Yan-Mei Chen et al.
http://arxiv.org/abs/1108.4719

The above figure from the paper shows the fraction of galaxies with recent star formation as a function of galaxy mass. The solid red,black and blue lines show the fraction of galaxies that have formed more than 5, 10, and 15% of their stars in the last billion years as a function of stellar mass. These results are for galaxies with median redshift z=0.1 in the SDSS low-redshift MAIN sample. The dashed red,black and blue lines show the same thing for galaxies with median redshift z=0.5 in the BOSS sample. Note the flattening and potential increase in the star formation rate for the most massive galaxies at z=0.5.

Massive galaxies are thought to represent the end-point of galaxy evolution. Small galaxies form first and then merge to create larger galaxies. Each merger should trigger a burst of star formation. At the present day the most massive galaxies we see around us are no longer forming new stars, which has been somewhat surprising because there are still galaxies merging today. But by looking back 5 billion years, BOSS astronomers were able to see massive galaxies still assembling and forming new stars.

This suppression of star formation in massive galaxies seen at the present day has been postulated to be due to several different exotic mechanisms that heat the gas and prevent it from forming stars. Examples range from giant explosions powered by material accreting onto central black holes of a billion or more solar masses, to megaparsec-scale jets of charged particles traveling at relativistic speeds, which penetrate and heat the gas surrounding the galaxies. The new results from SDSS-III indicate that these exotic mechanisms may have a much harder time stopping star formation in massive galaxies at higher redshifts.

The new technique and the unprecedentedly large galaxy sample, allowed the team to conclude that the fraction of the most massive galaxies with young stars has decreased by a factor of 10 over the last 4 billion years (see Figure) of the 13.7-billion year lifetime of the Universe. At redshift 0.5 (8-9 billion years after the Big Bang), more than 10% of all galaxies with stellar masses of around 200 billion solar masses have experienced a significant recent episode of star formation. These results are at odds with previous claims that the stars in massive galaxies all formed only 2-3 billion years after the Big Bang. The results are also exciting, because next generation X-ray satellites will be able to detect the gas as it cools and forms stars in these massive galaxies and next generation radio surveys will track how energetic particles propelled by black holes deposit their energy into this gas. Current speculation about exotic mechanisms will then be transformed into hard science.


Written by Guinevere Kauffmann
Edited by Michael Wood-Vasey

The paper submitted to Monthly Notices of the Royal Astronomical Society is available at:
http://arxiv.org/abs/1108.4719
And more details can be found at:
http://www.mpa-garching.mpg.de/mpa/research/current_research/hl2012-1/hl2012-1-en.html

Multiple Tidal Tails from the Sagittarius Dwarf Galaxy Wrap Around the Sky

The Milky Way galaxy continues to devour its small neighboring dwarf galaxies and the evidence is spread out across the sky.

A team of SDSS-III astronomers led by Sergey Koposov and Vasily Belokurov of the University of Cambridge recently discovered two streams of stars in the Southern Galactic hemisphere that were torn off the Sagittarius dwarf galaxy. This discovery came from analyzing data from the latest Data Release 8 from SDSS-III and was announced in a paper just released as (arXiv paper #1111.7042) that connects these new streams with two previously known streams in the Northern Galactic hemisphere. There is evidence that the brighter stream boasts stars with more heavy elements such as iron, while the fainter stream appears to be older.

(Image Credit: Sergey Koposov) The image above shows a map of the sky showing the numbers of stars counted in the Sagittarius streams. The colors indicate the distances to the stars identified in the study – stars located in red areas are further away, while stars in the blue areas are closer. The dotted red lines trace out the Sagittarius streams, and the blue ellipses in the center show the current location of the Sagittarius Dwarf Galaxy.

(Image Credit: Amanda Smith) The artist’s illustration above shows the four tails of the Sagittarius Dwarf Galaxy (the red-orange clump on the left of the image) orbiting the Milky Way. The bright yellow circle to the right of the galaxy’s center represents our Sun (not to scale). The Sagittarius dwarf galaxy is on the other side of the galaxy from us, but we can see its tidal tails of stars (white in this image) stretching across the sky as they wrap around our galaxy.

For more details see the full press release at http://www.sdss3.org/press/20111130.fourtails.php

BOSS Reaches Observing Milestone: 500,000 galaxies + 100,000 quasars

The SDSS-III Baryon Oscillation Spectroscopic Survey (BOSS) has just passed the milestone of observing 500,000 galaxies and 100,000 quasars. By the completion of the survey in 2014, BOSS will have observed 1.5 million galaxies and 250,000 quasars as it maps out the distribution of matter in the Universe and measures the properties of dark energy.

The first image, courtesy of Kyle Dawson (Utah), shows the BOSS coverage on the sky (right ascension and declination) of the current survey (red). The planned total coverage is shown in grey, and we’ve already drilled the plates for all of the tiles in blue.

The second image, courtesy of Michael Blanton (NYU), shows the redshift and right ascension coverage of the BOSS survey to date. While there are many more galaxies in the Universe beyond a redshift of 0.7, BOSS is focusing on galaxies between now and 6.5 billion years ago (redshift of 0.7, shown in white) when dark energy was just starting to have a noticeable effect. The red and yellow dots are the galaxies from the previous SDSS I/II surveys and show by contrast how much more of the Universe SDSS-III BOSS is exploring. The BOSS quasars, shown in cyan, probe the Universe out to 11.5 billion years ago to study the formation of black holes in the early Universe while also using their powerful light to explore the intervening material between those distant quasars and us. BOSS is aiming to obtain quasars between redshifts of 2 and 3 but is also taking repeat observations of lower-redshift quasars from SDSS I/II to study variability of these mysterious objects powered by massive black holes at the centers of galaxies.