SDSS Has Now Been Used by Over 5,000 Refereed Papers

There are now more than 5000 refereed papers that mention ‘SDSS’ or ‘Sloan’+’Survey’ in the title or abstract. These papers in turn have themselves been cited over 200,000 times. See http://tinyurl.com/42jxy for a detailed list.

These numbers are certainly an undercount as they do not include papers that do not explicitly refer to SDSS in the title or abstract. For example, a paper that used used SDSS data to generate target lists or comparison/calibration photometry may not have mentioned SDSS in the title or abstract.

Based on this set of 5000 papers, SDSS’s h number is 177 (177 papers with more than 177 citations), its g number is 322 (the average number of citations of the 322 most highly cited papers is 322), and it now has led to 409 papers with at least 100 or more citations.

In 2012, over 600 published papers alone refered to SDSS.

This search was made possible by the Astrophysical Data Service. For some related statistics and inspiration see Madrid and Macchetto, 2009, BAAS 41, 913 and Savaglio and Grothkpof, 2012, PASP, in press

Cross-calibrating Galactic Spectroscopic Surveys: APOGEE Provides Target List for a Subset of First Year Targets

The SDSS-III APOGEE survey is making excellent progress in mapping the Milky Way galaxy with near-infrared observations from the Northern Hemisphere sky. But to build a complete picture of our galaxy requires a joint effort in optical and near-infrared wavelengths from both the Northern and Southern Hemisphere.

To help coordinate observations with other current spectroscopic surveys such as GALAH, Gaia-ESO, RAVE, and LAMOST (LEGUE) and work toward a cross-calibrated understanding of stars in the Milky Way, the SDSS-III APOGEE survey has posted a list of selected target stars from the first year of observation (August 2011-June 2012).

The APOGEE team has put the coordinates and 2MASS stars identifications for a subset of stars that APOGEE has started (and in many cases finished) observing on the web:

http://www.sdss3.org/science/apogee_publications.php

These stars are selected to be located in fields with well-studied open and globular clusters, bulge fields, and equatorial fields. Most of these stars were observing in Year 1 of APOGEE and so the APOGEE spectra for these stars will be released in Data Release 10 (DR10) in July 2013.

APOGEE is releasing this list of stars in advance of DR10 to allow other Milky Way stellar surveys opportunities to plan their current and future observations.

Ji Wang: A Rising Star in the Search for Exoplanets

(by Brooke Kuei, Carnegie Mellon University)

Planets around other stars (exoplanets) can be discovered by measuring the motion of a star along the line-of-sight to Earth (its “radial” velocity). In the last 15 years, almost one thousand exoplanets have been discovered, revealing a surprising diversity in exoplanet masses and orbits about their stars. However, the exoplanets discovered through radial velocity searches have come from a heterogenous mixture of different surveys, telescopes, and samples. The goal of the SDSS-III MARVELS survey is to conduct a systematic controlled survey to produce a large sample of giant exoplanets that can be used to test theoretical models of the formation, migration, and dynamical evolution of giant planet and brown dwarf systems. Finding planets requires searching many stars with the accuracy and precision to detect the small changes in radial velocity introduced by planets orbiting them. The MARVELS survey thus required an instrument that could look at many objects simultaneously while still preserving precise velocity measurements.

Dr. Ji Wang spent six years as a graduate student at the University of Florida working under Prof. Jian Ge to help develop the innovative Dispersed Fixed Delay Interferometer (DFDI) technique employed by the MARVELS instrument. Unlike traditional high resolution echelle spectrographs often used for radial velocity searches for exoplanets, the MARVELS instrument combines a fixed-delay interferometer with a moderate dispersion spectrographs. This hybrid approach allows for high throughput, high precision measurements of many objects simultaneously. For details on how this technique was used for MARVELS see Ji Wang et al. 2012a and Ji Wang et al. 2012b.

JiWang_KPNO2p1m
Dr. Ji Wang spent many nights observing as part of the efforts to demonstrate the prototype for the MARVELS instrument at the 2.1-m telescope at Kitt Peak National Observatory (Image credit: PC Guo).

Wang grew up in Guilin, a small city sitting on the bank of the Li River in the far south of China. As a child, Wang was already reading physics and astronomy books; after years of diligence and education, he eventually ended up graduating from the University of Science and Technology of China with a Bachelor of Science in Astronomy. It was after graduation that Wang was faced with an intimidating yet exciting opportunity: a graduate school offer from the University of Florida, ten thousand miles away from home and across an entire ocean.

“It was a culture shock,” admitted Wang. “In China, English was only limited to the classroom. We didn’t really have anyone to practice speaking to.” And yet, despite the fact that this was his first time out of China, Ji not only successfully finished graduate school at the University of Florida with a PhD in Astronomy, but is now thriving as a postdoc at Yale University.

“Among all the courses I took, planetary science interested me the most,” says Wang. It was his deep interest in exoplanets that led to Wang’s involvement in SDSS-III. While he was a graduate student at the University of Florida, Wang initially became a part of the SDSS team by doing the labor-intensive work of cutting, polishing, and assembling fibers. His hard work paid off though, as he was eventually given the responsibility of calibrating and testing the MARVELS interferometer under Prof. Jian Ge. The result was a combination of an interferometer and spectrograph that is able to produce the same precision as a high resolution spectrograph by using less cost and a more compact instrument. The MARVELS instrument also has a multi-object capability; it can measure the radial velocities of 60 stars simultaneously, whereas most spectrographs used for planet searches can generally only look at one star at a time. “The optical path difference of the interferometer, usually referred to as the delay, needs to be very precisely determined,” explains Wang. “A precisely-measured delay is then used to calculate the radial velocity of the star.” The viability of the survey can be attributed in no small part to Wang’s careful calibration of the MARVELS instrument.

JiWang_MARVELS_fixed_delay_interferometer
The fixed delay interferometer for the MARVELS instrument. This interferometer is capable of interfering light from 60 fibers at the same time and provides a boost of sensitivity to Doppler shifts of a factor of 2. This picture shows the interference pattern of green mercury light in the lab. Each row represents the the light from a different fiber. (Image Credit: Xiaoke Wan)

Not only did Wang influence SDSS-III -– SDSS influenced Wang and other Chinese astronomers long before he came to the United States. “It’s resulted in many quality papers published by Chinese astronomers,” explained Wang. “Ten years ago, China was a lot less involved in international projects. SDSS has allowed China to get in touch with the latest astronomical data, creating a platform that has been a propelling force for Chinese astronomy.”

Now a postdoctoral associate at Yale University, Dr. Wang has recently led a paper that featured a planet discovered by citizen scientists working with data from the Kepler spacecraft as part of the Planet Hunters project, led by Prof. Debra Fischer.

Wang is a young astronomer, yet he has already made an integral contribution to a collaboration that has international influence. However, he believes that it is not only important to get people worldwide involved, but to get people from the general public involved as well, perhaps through projects such as Galaxy Zoo. “A lot of people are interested in space science and planet science. This is a good opportunity to present our results to the public and inspire others to get involved,” urged Wang. “It is our responsibility to invoke interest in astronomy and protect our field.”

Demonstrating the MaNGA Instrument at APO

MaNGA (Mapping Nearby Galaxies at APO) is one of the three surveys planned for the fourth generation of SDSS starting in 2014 http://www.sdss3.org/future/. The team has now successfully demonstrated instrumentation and observing procedures at Apache Point Observatory on the Sloan Foundation 2.5-m telescope.

The big technical challenge for the MaNGA instrument team has been to develop new bundle heads for the fibers which feed the BOSS spectrograph. These bundles enable many fibers to be places in a hexagonal grid across a galaxy:

MaNGA_galaxy_illustration

This will allow for resolved (or “integral field unit”; IFU) spectroscopy across the galaxy. The MaNGA survey will use these fiber bundles (which will vary in size from 19 to 127 fibers per bundle) to observe 10,000 nearby galaxies from 2014-2020.

Thanks to hard work from the instrument and data teams and support from the staff at APO and from SDSS-III, the MaNGA prototype IFU bundles have now successfully installed into an SDSS cartridge and used to obtain on-sky data along with to afternoon tests and calibrations.

Installation and First Light

MaNGA_ifu_bundle_installation
Nick MacDonald (UW) and Niv Drory (UNAM) led the installation of the MaNGA hardware, including the IFU bundles and 150 individual fibers, into the SDSS bright-time cartridge #1. With help from UW grad student Nell Byler and a few other helpful hands, the installation proceeded smoothly in about a day and a half.

MaNGA_plugging

MaNGA_plugging_1
Ting Xiao (SHAO) and Nell Byler (UW) inspected projected overlays on the first plate (top left) to determine which fibers and bundles should be plugged according to David Wake’s (Wisconsin) design. Veteran Sloan pluggers Francis Cope (APO) and Diana Holder (APO) then prepared the plate for the cartridge (top center) and plugged it (bottom and top right), providing valuable feedback about bending stresses in the fibers and the ease of plugging a complicated plate design.

MaNGA_v_grooves
Paul Harding (CWRU), Mike Blanton (NYU), and especially David Schlegel (LBNL) provided their expertise with remote support regarding cartridge layout, plate overlays, and the auto mapper that determines which fibers have been plugged into which holes. The fibers in each bundle are then spread out flat into “V grooves” (bottom right) where the light will be passed to the spectrograph to be spread out into its constituent wavelengths.

MaNGA_mounting
SDSS engineers Joe Huehnerhoff (UW) and Bob Pfaffenberger (APO) helped load the plugged MaNGA cartridge into the telescope for the first time. Behind the scenes, SDSS observer Kaike Pan drafted a series of scripts and tests that, thanks in part to quick off-site analysis by Renbin Yan, enabled the team to use the SDSS control software to carry out MaNGA observations. A day or two later, sunset at the 2.5 meter followed by First (Astronomical) Light for the MaNGA prototypes and a happy team at 4am local time.

MaNGA_slice_127_1comp

The highlight so far has been dithered observations of a plate designed to target stars and sample the PSF. MaNGA focused on several regions with 2-3 stars per bundle and MaNGA software pipeline developers David Law and Brian Cherinka (both U. of Toronto) have advanced the reduction pipeline to the point where they can produce preliminary 3D reconstructed data cubes from these observations! Here is an example of taken a 127-fiber bundle (top right) to observe a 25″x25″ region of the sky (SDSS image top center). Each fiber resulted in a spectrum . Integrating these spectra recovers the re-constructed image of these three stars as seen through the MaNGA IFU (top left).

SDSS-III at the American Astronomical Society meeting in Long Beach

The SDSS-III is at the 221st meeting of the American Astronomical Society. We have a number of talks and posters at this year’s meeting, including a special Thursday 10am morning session (Session 402, Room 102C) on the latest results from studying matter along the path to distant quasars.

LGB_Convention_Center

If you’re at the meeting please stop by and say hi. You could meet people like Jordan Raddick, SDSS-III education and public outreach and press officer; Peter Frinchaboy, key player in the APOGEE survey; or David Schlegel, principal investigator of the BOSS survey. They may not always be standing left-to-right as pictured below, but you can also learn about the latest results from APOGEE that they’re discussing displayed on the left.

AAS221_SDSS-III_booth_500

BOSS Survey and Plug Plate Featured in January 2013 National Geographic

The SDSS-III BOSS survey is highlighted in this month’s 125th anniversary issue of National Geographic. This news update features a dramatic image of one of the 1000-hole SDSS-III plates used to place the fiber optic cables. Each fiber optic cable carries the light of a target in the sky to the BOSS spectrograph where its light is split apart to identify the nature of distant galaxies and quasars and how much the Universe has expanded since that light was emitted.

ACT+BOSS Kinetic SZ Effect a Top 10 Breakthrough of 2012

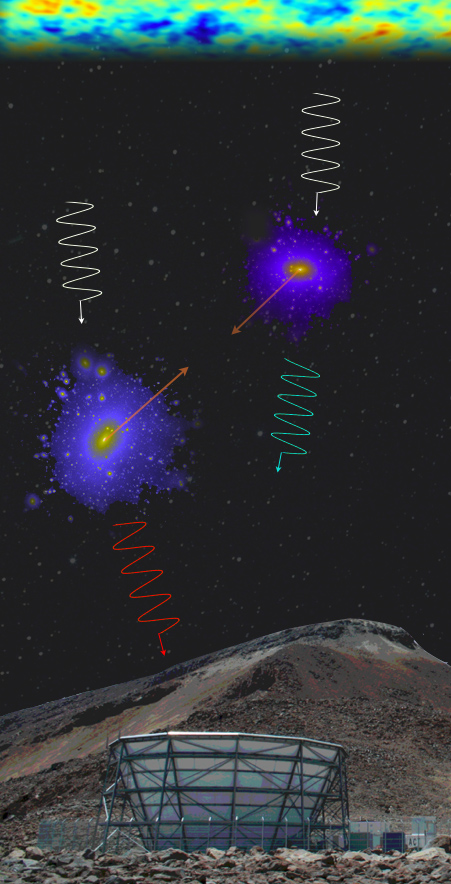
A paper published this year in Physical Review Letters (2012, 109, 041101), Evidence of Galaxy Cluster Motions with the Kinematic Sunyaev-Zel’dovich Effect, represented a joint collaboration between the Atacama Cosmology Telescope and the SDSS-III BOSS survey. This work presented the first detection of the kinetic Sunyaev-Zeldovich effect.

This paper has just been recognized by Physics World as one of the Top 10 Breakthroughs of 2012:

http://physicsworld.com/cws/article/news/2012/dec/14/physics-world-reveals-its-top-10-breakthroughs-for-2012

APOGEE Sets Record of 54,000 High-Resolution Infrared Spectra in Two Months

The APOGEE survey had stupendously productive October and November bright runs[*] with 206 plates successfully observed. This achievement is a great credit to the Apache Point Observatory mountain observing and engineering staff, who worked hard to complete these observations while simultaneously performing system maintenance and validation. Thanks to their efforts 107 plates were observed during the October bright run and 99 during the November bright run. This total of 206 observations included multiple observations of 120 unique plates covering 87 different fields on the sky, for a total of 54,000 new spectra of over 23,000 stars, including 11,000 previously unobserved stars.

The APOGEE survey is currently on pace to finish its goal of observing 100,000 stars by the end of the SDSS-III survey in 2014.Those interested in the future of APOGEE and the Sloan Foundation 2.5-m Telescope after SDSS-III are invited to read about the plans for a trio of surveys that will study our own galaxy and beyond

http://www.sdss3.org/future

[*] A “bright run” is the time the moon is bright in the sky, roughly from one week before full moon through one week after new moon. The moon makes the background sky much brighter in visual wavelengths (note how many more stars you can see with your eyes when the moon is below the horizon compared to the night of a full moon). But the additional brightness of the moon is much less important in the infrared, so infrared observations are generally scheduled for times the moon is up, while visual-wavelength observations, such as those of the BOSS survey, are scheduled for times when the moon is below the horizon or only partially illuminated from our perspective on Earth.

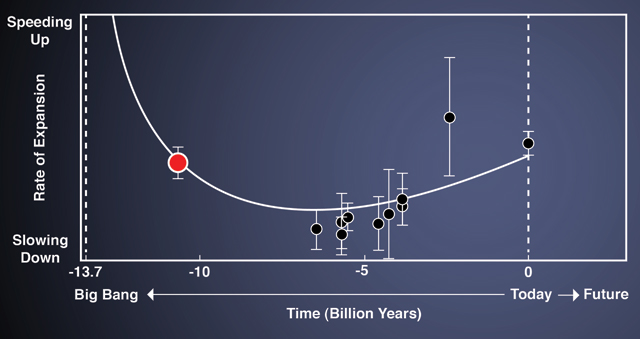
BOSS Detects Baryon Acoustic Oscillations in the Lyman-alpha Forest at z of 2.3.

SDSS-III astronomers announce today the first detection of BAO in the Lyman-alpha forest 11 billion years ago. The paper has been submitted to Astronomy & Astrophysics and is available on arXiv:

“Baryon Acoustic Oscillations in the Ly-α forest of BOSS quasars”
N. Busca et al.
Submitted to Astronomy & Astrophysics
http://arxiv.org/abs/1211.2616


The new BOSS Lyman-alpha measurement of H(z)/(1+z) is illustrated by the red dot.


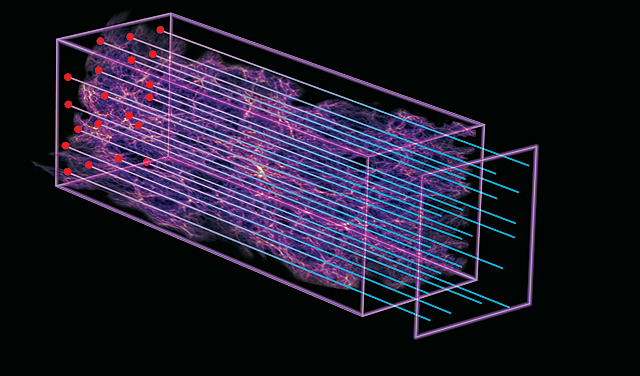
The Lyman-alpha forest is detected through the imprint of hydrogen cloud absorpt
ion lines on the light from background quasars.

For more details see today’s press release at

http://www.sdss3.org/press/lyabao.php

DR9 BOSS Galaxy Clustering Ancillary Data Now Available

The SDSS-III BOSS Galaxy Clustering Working Group has collected its primary DR9 science results and ancillary data and made them available to the public on the SDSS-III public web site. The goal is to provide sufficient information for the wider astronomical community to recreate and perhaps even improve these analyses. At http://www.sdss3.org/science/boss_publications.php, one can find the following data products:

* Tabulated correlation function measurements and power spectrum measurements, both pre- and post-reconstruction, used in the detection of the BAO feature in Anderson et al. Covariance matrices for all measurements are included as well.
* Tabulated correlation function measurements and errors from the analysis of the full shape of the CMASS clustering signal from Sanchez et al.
* Tabulated measurements and covariance matrices for the redshift-space multipoles of the CMASS correlation function, from Reid et al and Samushia et al. A software package to compute the theoretical correlation functions is also linked to from the public SDSS-III SVN.
* CosmoMC modules that allow users to incorporate the BAO detection and the theoretical analyses of the redshift-space multipoles into CosmoMC Markov chains.
* Tabulated results from the enhanced redshift distortions analysis of Tojeiro et al.
* Small-scale correlation functions, both redshift-space and projected, and errors from Nuza et al.

At this web page, we also include high-quality figures from these papers that we encourage people to include in presentations that incorporate BOSS results. Questions about the files should be directed at the corresponding author of the paper from which the measurements came.

1) Anderson et al:
“The clustering of galaxies in the SDSS-III Baryon Oscillation Spectroscopic Survey: Baryon Acoustic Oscillations in the Data Release 9 Spectroscopic Galaxy Sample”
http://arxiv.org/abs/1203.6594

2) Reid et al:
“The clustering of galaxies in the SDSS-III Baryon Oscillation Spectroscopic Survey: measurements of the growth of structure and expansion rate at z=0.57 from anisotropic clustering”
http://arxiv.org/abs/1203.6641

3) Sanchez et al:
The clustering of galaxies in the SDSS-III Baryon Oscillation Spectroscopic Survey: cosmological implications of the large-scale two-point correlation function
http://arxiv.org/abs/1203.6616

4) Nuza et al:
“The clustering of galaxies at z~0.5 in the SDSS-III Data Release 9 BOSS-CMASS sample: a test for the LCDM cosmology”
http://arxiv.org/abs/1202.6057

5) Manera et al:
“The clustering of galaxies in the SDSS-III Baryon Oscillation Spectroscopic Survey: a large sample of mock galaxy catalogues”
http://arxiv.org/abs/1203.6609

6) Samushia et al:
“The Clustering of Galaxies in the SDSS-III DR9 Baryon Oscillation Spectroscopic Survey: Testing Deviations from Lambda and General Relativity using anisotropic clustering of galaxies”
http://arxiv.org/abs/1206.5309

7) Tojeiro et al:
“The clustering of galaxies in the SDSS-III Baryon Oscillation Spectroscopic Survey: measuring structure growth using passive galaxies”
http://arxiv.org/abs/1203.6565

Gone with the wind: new study finds quasars that change quickly

A new SDSS press release is up! This time, we’re featuring work led by Nurten Filiz Ak of Penn State, studying disappearing broad absorption line troughs in quasars. They have found several quasars in which the BAL trough disappears over a nine-year period. The simplest explanation for this observation is that as the quasar’s accretion disk has rotated, carrying the absorption region out of the line of sight between us and the quasar. In other words, as the press release says, the gas cloud is…

Gone, with the Wind

A glowing red-orange disk surrounding a small black dot, with thick blue lines radiating out from the center. An inset on 	the top left shows two SDSS spectra, which appear as wavy red and blue lines.

An artist’s impression of a quasar, along with its spectra from SDSS observations

Galaxy Zoo is a go!

One of the most fun parts of the Sloan Digital Sky Survey has been Galaxy Zoo, which connects our survey with citizen scientists all over the world. And now, the fun is still going!
A green banner that says, "Galaxy Zoo"

The original Galaxy Zoo launched in July 2007, to immediate success beyond our wildest expectations. Within a few days, thousands of people had signed up to classify images of nearly one million SDSS galaxies as spiral or elliptical. The project released its data in 2009; by that time, hundreds of thousands of citizen scientists had worked together to classify each of the galaxies more than 70 times over. Since then, professional astronomers have used that dataset to publish more than 20 peer-reviewed papers in scientific journals, with more to come.

Last week, a new version of Galaxy Zoo launched. The new site features images from the SDSS’s Data Release 9, including images of thousands of galaxies south of the plane of the Milky Way that are being shown to citizen scientists for the first time. The new site also includes images from the Hubble Space Telescope’s CANDELS survey, allowing us to compare galaxies as seen by SDSS to similar galaxies from the distant past.

The new Galaxy Zoo is open for business, and needs your help! Go to the new site and click “Classify Galaxies” to get started. Have fun, and the sky’s the limit!

The Galaxy Zoo web interface with a galaxy image and a button saying, "Classify Galxies"

The Ninth Data Release of the Sloan Digital Sky Survey III

The Sloan Digital Sky Survey III (SDSS-III) has released the largest-ever three-dimensional map of massive galaxies and distant black holes, which will help astronomers explain the mysterious dark matter and dark energy that makes up 96 percent of the universe.

Data Release 9 is the latest in a series of data releases stretching back to 2001. This release includes new data from the ongoing SDSS-III Baryon Oscillation Spectroscopic Survey (BOSS), which will eventually measure the positions of 1.5 million massive galaxies over the past six billion years of cosmic time, as well as 160,000 quasars — giant black holes actively feeding on stars and gas — from as long ago as 12 billion years in the past.

DR9 is available at: http://www.sdss3.org/dr9.

READ THE PRESS RELEASE HERE

WATCH A FLY-THROUGH BY CLICKING BELOW:

SDSS-III Collaboration Meets in Rio de Janeiro

The 2012 SDSS-III Collaboration meeting was held June 26-29 at the Observatório Nacional in Rio de Janeiro, Brazil. Thanks to the hard work of the local organizers a great and productive time was had by all.


The meeting caught the interest of a local major newspaper, “O Globo”, which published a nice summary of the SDSS-III project at:


http://oglobo.globo.com/ciencia/astronomia-de-olhos-bem-abertos-5329246

APOGEE confirms its first known exoplanet!

Today’s post is a personal story of an exciting discovery from SDSS-III, written by SDSS astronomer David Nidever of the University of Virginia.

I just wanted to share the exciting news that APOGEE confirmed a known exoplanet! Now that we’ve shown that APOGEE can measure radial velocities precisely enough to find a known planet, this opens up a whole new range of scientific questions to study.

The exoplanet HD 114762b - 11 times the size of Jupiter

The size of the exoplanet confirmed by APOGEE – HD 114762b – compared to planets in our Solar System. (image from The Visual Exoplanet Catalogue)

APOGEE’s spectrometers can now measure changes in a star’s radial velocity of less than 50 meters per second (about 110 miles per hour) – we could see a change in a star’s velocity corresponding to the speed of a sports car, from halfway across the galaxy. And not even a particularly fast sports car! Because we can measure stellar velocities so precisely, we can see the back-and-forth motions of the stars exerted by objects orbiting those stars, such as smaller companion stars or even planets.

And now we’ve seen one: the planet we rediscovered is called HD 114762b. Looking through the first batch of fields that had been observed at least 8 times, APOGEE detected clear signals of radial velocity shifts of 500 m/s from the star HD 114762, a fairly ordinary-looking main sequence star just a little hotter than the Sun***.

In 1989, Harvard astronomer David Latham discovered an unseen companion around HD 114762. He thought it might be a planet, but he didn’t have quite enough evidence to be totally sure. He wrote up his results in a Nature paper. Ten years later, our colleague Geoff Marcy (UC Berkeley) found fairly convincing evidence that HD 114762b is in fact an exoplanet, which he described in a paper in the Astrophysical Journal. It’s possible that it’s a brown dwarf, but an exoplanet is the more likely explanation.

Let me tell you the story of how we found it again.

The APOGEE*** project has been running since last summer, measuring spectra of stars in the Milky Way disk. In many cases, we’ve been getting spectra for the same stars over and over again.

For the past few months, I’ve been looking at approximately 1,300 stars – each of which has 8 or more APOGEE observations*** – that I had flagged as potential binaries due to large variations in their radial velocities. I used data from those observations as input into a computer program that fits the orbits of the binary stars*** – for each binary star system, the code creates a plot that tells me the most likely orbital path of each star. Of course, if one of the two “stars” in the system turns out to be a brown dwarf or a planet, the code will tell me the orbit of the brown dwarf or planet, as well as its mass.

After I generated the orbit plots, I looked through them all by eye, one by one, to find the ones whose orbits were most certain. We found several hundred good orbital fits; of those several hundred orbits, 45 looked like they could belong to brown dwarfs or planets.

We had the opportunity to observe some of these candidates with the Hobby-Eberly Telescope (HET). With a mirror nine meters (30 feet) in diameter, the HET is much bigger than the SDSS’s 2.5 meter telescope, so we can use it to collect better data – hopefully good enough to confirm whether one or more of these objects is actually a brown dwarf or planet. But observing time on large telescopes is hard to come by, and we only had enough time to get spectra for 10. So which ten would we choose?

Last Thursday night, I was talking with Scott Fleming, Rohit Deshpande, Suvrath Mahadevan, Matthew Shetrone, and Fred Hearty. (I should also mention here that Suvrath and Matthew gave us some of their observing time to look at these spectra – thanks!!) We were coming up with our final list of ten stars when Suvrath suggested that we check whether any of the stars on our list had been spotted as binary stars in previous surveys. Scott checked online, and that’s when we discovered that star #2 on our list was HD 114762! The graph below shows the data we collected from HD 114762. The line going up and down in the top of the graph represents the back-and-forth motion of the star – a clear sign of an orbiting planet!

A graph showing the back-and-forth motion (radial velocity) of the star HD 114762 due to the gravitational attraction of its orbiting planet, HD 114762b (image created by Scott Fleming)

What we know about the exoplanet HD 114762b is collected in its entry in the Visual Exoplanet Catalogue. HD 114762b’s orbit is known – the orbital parameters are available in its entry at exoplanets.org.

This isn’t an Earth-shattering (galaxy-shattering?) new discovery – after all, we already knew that HD 114762b is most likely an exoplanet, and Geoff Marcy’s team has measured its orbit quite precisely. But we’re very excited about APOGEE’s discovery, because it points to many more exciting things in the future. We knew APOGEE’s radial velocity measurements would be good, but not necessarily good enough to find exoplanets. This new discovery opens up a whole new regime of scientific exploration. Watch this space for many more exciting things to come!

P.S. We didn’t plan it this way, but it turns out that today’s post relates well to today’s today’s xkcd webcomic!


Footnote 1. The “HD” means it was first seen as part of the “Henry Draper Catalog” in the early 1900s. Back to main post


Footnote 2. “APOGEE” stands for “Apache Point Observatory Galactic Evolution Experiment.” Back to main post


Footnote 3. We identified that these stars were binaries due to their highly variable radial velocities, initially using the regular pipeline RVs, then my own RVs using the star’s combined spectrum as the RV template, which reduced the RV errors by a factor of two to three.) Back to main post


Footnote 4. The code was written by Geoff Marcy and his team. I used to work for him as an undergrad at San Francisco State University, and he kindly gave us permission to use the code for APOGEE. Back to main post