“Galaxy Zoo 2: detailed morphological classifications for 304,122 galaxies from the Sloan Digital Sky Survey”

SDSS-III Data Release 10 features crowd-sourced classifications of the shape of 304,122 galaxies from images taken by SDSS. The paper describing these data is in press at the Monthly Notices of the Royal Astronomical Society and is available on the arXiv preprint server: “Galaxy Zoo 2: detailed morphological classifications for 304,122 galaxies from the Sloan Digital Sky Survey”.

This paper was led by Galaxy Zoo science team member Kyle Willet, from the University of Minnesota, and presents morphological classifications for 304,122 SDSS galaxies constructed from over 60 million clicks contributed by members of the public at the Galaxy Zoo website.

You can read more about the paper on the Galaxy Zoo blog (http://blog.galaxyzoo.org/2013/08/19/galaxy-zoo-2-data-release/)

The data described in this paper are available through both Galaxy Zoo at http://data.galaxyzoo.org, and through SDSS-III Data Release 10 at http://www.sdss3.org/d110

Galaxy Zoo work continues at http://galaxyzoo.org. On the site right now members of the public are looking at more images from the SDSS (the full DR8 imaging area) as well as some from the Hubble Space Telescope. The Galaxy Zoo team is also working hard to bring you images of your favourite galaxies in the infrared soon.

The Tenth Data Release of the Sloan Digital Sky Survey III

The Sloan Digital Sky Survey III (SDSS-III) has just released the largest comprehensive sample of high-resolution infrared spectra of 57,000 stars in our Milky Way.

Data Release 10 is the latest in a series of data releases stretching back to 2001. This release includes the first data from the Apache Point Observatory Galactic Evolution Experiment (APOGEE), and includes an additional year of data from the ongoing SDSS-III Baryon Oscillation Spectroscopic Survey (BOSS). APOGEE is obtaining R~22,500 spectra of 100,000 red giant stars sampled through the bulge, disk, and halo of our galaxy. These spectra allow astronomers to determine radial velocities, temperatures, surface gravities, and abundances of elements in these stars.

BOSS has now obtained spectra for almost 1.4 million objects, including 860,000 galaxies and 105,000 quasars from (2<z<3.5), as part of its quest to measure the positions of 1.5 million massive galaxies over the past six billion years of cosmic time, as well as 160,000 quasars — giant black holes actively feeding on stars and gas — from as long ago as 12 billion years in the past.

DR10 is available at: http://www.sdss3.org/dr10.

READ THE PRESS RELEASE HERE

Zooming in on Clouds of Hydrogen when the Universe was Young

SDSS-III scientists in the Baryon Oscillation Spectroscopy Survey (BOSS) have just completed the second phase of a project to provide a map of the observable universe showing the positions of giant clouds of hydrogen gas. BOSS is mapping the Universe by measuring the positions of galaxies, clusters of galaxies, and clouds of hydrogen gas. These maps allow astronomers to understand the history of the universe, starting with the Big Bang all the way through to the formation of the galaxies, stars, and planets that provide the site for the development of life.

Hydrogen is the most abundant element in the Universe. Thus measuring the position of hydrogen gas clouds reveals important details on the distribution of normal matter in the Universe. To detect these hydrogen clouds, BOSS uses super-luminous quasars as backlights. Quasars can be billions of times brighter than the Sun and are currently thought to be powered by matter falling into super-massive black holes. The quasars that BOSS uses as backlights are located billions of light-years from us, when the Universe was one fifth its current age of 13.7 billion years.

Because light travels at a finite speed (186,000 miles per second) this extreme distance means that we are also looking further back in time, back to when things in the Universe were closer together. As the light travels from the quasar to us, the Universe has expanded and so the light from the quasar is stretched out – a phenomenon known as redshift.

The light that the BOSS detector receives is partially absorbed by the intervening gas clouds and the pattern of absorption gives a map of the gas. Each gas cloud absorbs at a wavelength particular to a given energy transition in hydrogen.
The redshifting of the quasar light means that each cloud leaves an imprint at a different wavelength in the light we eventually observe from the quasar. The amount of absorption in the quasar spectrum at any given wavelength reveals the position of a hydrogen gas cloud between us and the quasar.

A map of the entire Earth at first glances reveals large features like continents, but reveals mountains, hills, and valleys when you zoom in. In the first phase of BOSS, scientists used a very coarse-grained map of the absorption due to hydrogen to study the “large-scale structure” of the universe at scales of hundreds of million light years, analogous to studying the size and disposition of the continents on the surface of the Earth. BOSS’s “continents” were clouds typically many millions of light-years in size. BOSS found that the gas was arranged in a pattern that reflected sound waves that existed during the first 380,000 years after the big bang. The pattern gave information on the conditions in the universe at this time and confirmed that the Universe consists of a strange cocktail of normal matter, photons, neutrinos, dark matter (matter that doesn’t interact with light and that forms the bulk of galaxies), and the completely mysterious dark energy which is currently driving the increasing expansion rate of the Universe.

20130716_gas
SDSS-III scientists are producing detailed numerical simulations of the universe to compare to BOSS observations. This image shows a simulated map of the gas clouds (the red blobs are clusters of galaxies and the blue filaments are lower-density gas regions), in a cube of the universe 65 million light-years on a side.

In the second phase of their effort, BOSS scientists have been able to zoom in using more sensitive techniques to study the “small-scale” structures, down to scales of a few million light years, analogous to the mapping the mountains on a continent. This increased resolution reveals the characteristics of the gas clouds that are on the brink of forming galaxies.

The new BOSS observations so far appear consistent with current theories of the composition of the Universe. But this new data is sufficiently precise that BOSS hopes to use it to glean information on one of the least understood ingredients of the cocktail: neutrinos. These (ghostly) objects move through the universe nearly at the speed of light and cannot condense to form galaxies. However, their presence has an effect on the map of the gas clouds. The speeding neutrinos dilute the pattern that seeded the gas clouds. Current measurements indicate that neutrinos have a tiny mass (about one billionth of the mass of an electron). The cosmological maps from BOSS reflect its effects on the “small-scale” structures of the universe. Further analysis will reveal new constraints on the mass density of neutrinos in the cosmos.

The paper “The one-dimensional Ly-α forest power spectrum from BOSS” by N. Palanque-Delabrouille et al. was recently submitted to Astronomy & Astrophysics and is available at http://arxiv.org/abs/1306.5896

[youtube=http://www.youtube.com/watch?v=ATAHrwwrNqk&w=500&h=375&rel=0&modestbranding=1]
A simulation of the interaction of dark matter, gas, stars, and neutrinos in forming the structure of galaxies we observe. The overall expansion of the Universe has been scaled out of this simulation to more clearly illustrate how the large scale structure forms. Previous work mapped hydrogen clouds on the scale of this box. The current work can map down to the scale of the red spheres shown here that are turning into galaxies.

20130716_neutrino
This second image is a map showing the ghostly neutrinos, here drawn in yellow, in the same cube of universe. The only hint of condensation appears about the largest density region, in the center of the image. With further analysis BOSS scientists plan to explore this faint imprint on the structure of hydrogen clouds from neutrinos in the early Universe.

Our Deepest Sympathies and Thanks to the Wildfire Fighters in the American Southwest

We in the Sloan Digital Sky Survey collaboration are deeply saddened by the news of the loss of 19 firefighters from the Granite Mountain Hotshots of Prescott, Arizona.

There is a closer connection between astronomy and these hotshot crews than many may know. Fire is the top threat to the observatories of the American Southwest. Our facilities are at dry and remote sites, typically high up in the pine forests that top the mountains. Summer fires are a perennial danger.

While the Apache Point Observatory where the SDSS facility is housed has been lucky to escape direct threat in the last twenty years, several other major observatories have had close calls. That catastrophe has been averted is due largely to the tremendous efforts of the wilderness firefighters and response teams that work to contain these fires and shape them away from inhabited areas. Their skill and strength in combating these fires is truly remarkable.

We don’t know whether any members of the Granite Mountain Hotshots worked on fires near our observatories, but their loss is dear to us nonetheless. We want to take this opportunity to thank all of the firefighters working in the forests of the Southwest for their dedication, and we want to recognize the important role that they play in American astronomy. Most importantly, we want to send our condolences to the families and friends of those lost in this tragedy.

Donations to help the families and coworkers of the firefighters who died battling the Yarnell Hill Fire can be made at the following website:

http://www.prescottffcharities.org/how-you-can-help/

Finally, we want to recognize the important work that goes on locally at our location. Fire prevention is a year-round activity at Apache Point Observatory (APO). APO Site Manager Mark Klaene is a Captain in the the High Rolls Volunteer Fire Department (VFD) and a Lieutenant in the Sunspot VFD. SDSS Engineer Tracy Naugle is a firefighter in the Sunspot VFD, and APO 3.5-m telescope observer Alysha Shugartis is a probationary firefighter in the Sunspot VFD. APO and SDSS specifically thank the Lincoln National Forest branch of the U.S. Forest Service for their efforts to manage the forest around APO and keep our observatory safe.

SDSS Pioneer Recognized as a Champion of Change by the White House

The White House recently recognized 13 individuals as “Champions of Change” for Open Science: people who worked to make data public for the greater good:
http://www.whitehouse.gov/champions/open-science

One of the thirteen was Princeton University’s Jeremiah P. Ostriker, recognized for his role in the development of the Sloan Digital Sky Survey. This recognition reflected SDSS’ record of making its data public to the world, enabling the writing of literally thousands of papers. The ceremony, which took place on June 20 in the Eisenhower Executive Office Building, adjacent to the White House, included an open discussion among the 13 Champions, as well as talks by John Holdren (Director of the White House Office of Science and Technology Policy) and Todd Park (Chief Technology Officer of the United States). Prof. Ostriker invited five guests to take part in the ceremony. The visiting group is shown here left-to-right starting from the upper left: Michael Strauss (former SDSS spokesperson), Al Sinisgalli (who was key in arranging Princeton’s financial support of the project), Don York (SDSS’ first director), Ostriker, Jill Knapp (scientist par excellence who kept the project going through sheer force of will) and Jim Gunn (SDSS Project Scientist).

ChampionsOfChange_20130701
(Image Credit: Anjelika Deogirikar)

The Mass-Metallicity Relation with the Direct Method on Stacked Spectra of SDSS Galaxies

SDSS astronomers at Ohio State have made a new, more robust measurement of the relationship between stellar mass and the abundance of elements heavier than helium and hydrogen. The measurement of elements is called the “gas-phase metallicity” and is based on measuring weak auroral lines that are typically undetected in galaxy spectra (dubbed the “direct method”). The relationship between these two is called the mass-metallicity relationship. To enhance the signal-to-noise ratio of these lines, the astronomers stacked ~200,000 galaxy spectra from the SDSS-II Data Release 7.


(Figure) The new mass-metallicity relation is shown by the points and black line. The colored lines indicate previous mass-metallicity relations based on less certain strong line methods. This new measurement of the mass-metallicity relation provides important constraints for galaxy evolution models, especially for the efficiency of galactic winds.

Lead author Brett Andrews has prepared a brief video describing the main results for a general audience:

For more details please see the published paper:
“The Mass-Metallicity Relation with the Direct Method on Stacked Spectra of SDSS Galaxies”
Andrews & Martini (2013)
The Astrophysical Journal, 765, 140.
http://arxiv.org/abs/1211.3418
http://adsabs.harvard.edu/abs/2013ApJ…765..140A

Two Megaspectra Across Four Cubic Gigaparsecs

In April BOSS passed an impressive milestone with 2 million survey-quality spectra. These spectra now probe large volumes of the Universe. The galaxy spectra alone probe over 35 billion cubic lightyears (four cubic gigaparsecs), while the BOSS quasars probe an even larger volume but much more sparsely. BOSS is on pace to successfully complete its main survey of 10,000 square degrees, which is almost one quarter of the sky, by the end of SDSS-III observing in the summer of 2014.

Officially, the prize for the two millionth object goes to a spectrum of the blank sky.


BOSS Spectrum of a Region of Blank Sky


Figure: The two-millionth BOSS spectrum: an observation of a blank region of the sky (green line). Most of the emission that is seen is from the Earth’s atmosphere. The peaks in the right half of the figure are emission lines from oxygen, water, carbon dioxide, and other molecules. After subtracting the sky, the remaining signal (black line) is consistent with no detected source. The quoted redshift in light green is the BOSS pipeline fitting a quasar so faint that it is entirely consistent with the noise from the observation; this is not a real detection of an object.

Why does BOSS intentionally take observations of blank regions in the sky?

It turns out that these sky spectra are actually vital to the basic analysis of the BOSS spectra of stars, galaxies, and quasars. Most of the photons detected by BOSS are emitted by the Earth’s atmosphere. We have to subtract these photons to analyze the faint signals of distant galaxies. About 10% of BOSS fibers on each plate are used to observe blank regions of the sky. BOSS takes these blank-sky observations to help in calibration and removing the sky background.

These blank sky spectra can also have scientific utility. These blank sky spectra are the easiest targets from which to study the diffuse interstellar medium, as done by Brandt & Draine:
http://arxiv.org/abs/1109.4175
They are also used to search for serendipitous observations of emission-line galaxies. While the fibers are placed in locations that the SDSS-III imaging data show to be blank, galaxies that emit most of their light in just a few emission lines can occassionally appear in these spectra. Such galaxies are very uncommon today and understanding their presence at high redshift (which is necessary for their ultraviolet emission lines to be observed in the visual region of the spectrum) can help us learn about the early process of galaxy formation.

Outflows from Star Formation May Drive Calcium into the Halos of Galaxies

Calcium (Ca) came from stars. Along with all other elements other than hydrogen, helium, and a bit of lithium, calcium was made in the fusion furnaces that power the immense amounts of energy given off by stars. To make calcium requires a star at least five times the mass of our Sun and is most efficiently produced by even more massive stars that explode as supernovae and distribute their elements to their surroundings[1]. What happens to this material and how it gets distributed around a galaxies is a key current question in the formation of galaxies.

SDSS-III members Guangtun Zhu and Brice Ménard (Johns Hopkins University) have just completed a study searching for Ca II around galaxies in SDSS Data Release 7. This paper has been submitted to the Astrophysical Journal and appears on today’s arXiv.org:

“Calcium H&K Induced by Galaxy Halos”
Guangtun Zhu, Brice Ménard
http://arxiv.org/abs/1304.0451

Using signatures imprinted in the spectra of distant quasars, they find that Ca II, calcium missing one of the two electrons in its outermost subshell, exists in the outskirts of galaxies, and there is a lot of it.

The search for Ca II used the Fraunhofer H&K absorption lines. These absorption lines were first discovered in the solar spectrum about 200 years ago. The wavelengths of these lines are defined by the amount of energy difference between the outermost electron of singly-ionized calcium to be in the 4s (l=0) instead of 4p state (l=1). The difference in energy between H and K is the difference between the spin of the electron (s=1/2) being in the same direction (more energy, labmda=396.8 nm, J=|l+s|=3/2) or in the opposite direction (less energy, lambda = 393.4 nm, J=|l-s|=1/2) as its orbital momentum around the nucleus[2].

When light passes through a cloud of Ca II, photons with wavelengths at 383.4 nm and 396.8 nm can be absorbed, leaving a signature in the light that passes through the cloud.


Examples of background quasars whose light passes near galaxies. Images and quasar spectra were both taken with the SDSS.

Thus the researchers set out to search for signs of a small amount of missing light at these wavelengths. However, the signature of Ca II absorption in an individual quasar spectrum is almost impossible to see. This study was thus only possible by combining the vast quantity of spectra made available by SDSS. By using the light from 100,000 background quasars that passes near galaxies in SDSS DR7, Zhu and Ménard found that significant amounts of Ca II were present up to 700,000 light years (200 kpc) away from the galaxies.


The image above shows the density of Ca II (right axis) as a function of the distance (rp) from the center of the galaxy. Significant amounts of Ca II are found all the way out to 200 kpc (700,000 light years).

The Ca II is more concentrated around star-forming galaxies than passive galaxies and is preferentially found above the plane of disk galaxies. These results are consistent with the Ca II coming from bipolar outflows from the galaxies that are driven by star formation. These outflows carry along many of the elements formed in the stars and released by supernovae.

This study is only sensitive to Ca in this ionization state where it has lost one electron. The distribution of neutral Ca or other ionization states remains unknown.

[1] http://en.wikipedia.org/wiki/Supernova_nucleosynthesis
[2] http://physics.nist.gov/PhysRefData/Handbook/Tables/calciumtable4.htm

SDSS Has Now Been Used by Over 5,000 Refereed Papers

There are now more than 5000 refereed papers that mention ‘SDSS’ or ‘Sloan’+’Survey’ in the title or abstract. These papers in turn have themselves been cited over 200,000 times. See http://tinyurl.com/42jxy for a detailed list.

These numbers are certainly an undercount as they do not include papers that do not explicitly refer to SDSS in the title or abstract. For example, a paper that used used SDSS data to generate target lists or comparison/calibration photometry may not have mentioned SDSS in the title or abstract.

Based on this set of 5000 papers, SDSS’s h number is 177 (177 papers with more than 177 citations), its g number is 322 (the average number of citations of the 322 most highly cited papers is 322), and it now has led to 409 papers with at least 100 or more citations.

In 2012, over 600 published papers alone refered to SDSS.

This search was made possible by the Astrophysical Data Service. For some related statistics and inspiration see Madrid and Macchetto, 2009, BAAS 41, 913 and Savaglio and Grothkpof, 2012, PASP, in press

Cross-calibrating Galactic Spectroscopic Surveys: APOGEE Provides Target List for a Subset of First Year Targets

The SDSS-III APOGEE survey is making excellent progress in mapping the Milky Way galaxy with near-infrared observations from the Northern Hemisphere sky. But to build a complete picture of our galaxy requires a joint effort in optical and near-infrared wavelengths from both the Northern and Southern Hemisphere.

To help coordinate observations with other current spectroscopic surveys such as GALAH, Gaia-ESO, RAVE, and LAMOST (LEGUE) and work toward a cross-calibrated understanding of stars in the Milky Way, the SDSS-III APOGEE survey has posted a list of selected target stars from the first year of observation (August 2011-June 2012).

The APOGEE team has put the coordinates and 2MASS stars identifications for a subset of stars that APOGEE has started (and in many cases finished) observing on the web:

http://www.sdss3.org/science/apogee_publications.php

These stars are selected to be located in fields with well-studied open and globular clusters, bulge fields, and equatorial fields. Most of these stars were observing in Year 1 of APOGEE and so the APOGEE spectra for these stars will be released in Data Release 10 (DR10) in July 2013.

APOGEE is releasing this list of stars in advance of DR10 to allow other Milky Way stellar surveys opportunities to plan their current and future observations.

Ji Wang: A Rising Star in the Search for Exoplanets

(by Brooke Kuei, Carnegie Mellon University)

Planets around other stars (exoplanets) can be discovered by measuring the motion of a star along the line-of-sight to Earth (its “radial” velocity). In the last 15 years, almost one thousand exoplanets have been discovered, revealing a surprising diversity in exoplanet masses and orbits about their stars. However, the exoplanets discovered through radial velocity searches have come from a heterogenous mixture of different surveys, telescopes, and samples. The goal of the SDSS-III MARVELS survey is to conduct a systematic controlled survey to produce a large sample of giant exoplanets that can be used to test theoretical models of the formation, migration, and dynamical evolution of giant planet and brown dwarf systems. Finding planets requires searching many stars with the accuracy and precision to detect the small changes in radial velocity introduced by planets orbiting them. The MARVELS survey thus required an instrument that could look at many objects simultaneously while still preserving precise velocity measurements.

Dr. Ji Wang spent six years as a graduate student at the University of Florida working under Prof. Jian Ge to help develop the innovative Dispersed Fixed Delay Interferometer (DFDI) technique employed by the MARVELS instrument. Unlike traditional high resolution echelle spectrographs often used for radial velocity searches for exoplanets, the MARVELS instrument combines a fixed-delay interferometer with a moderate dispersion spectrographs. This hybrid approach allows for high throughput, high precision measurements of many objects simultaneously. For details on how this technique was used for MARVELS see Ji Wang et al. 2012a and Ji Wang et al. 2012b.

JiWang_KPNO2p1m
Dr. Ji Wang spent many nights observing as part of the efforts to demonstrate the prototype for the MARVELS instrument at the 2.1-m telescope at Kitt Peak National Observatory (Image credit: PC Guo).

Wang grew up in Guilin, a small city sitting on the bank of the Li River in the far south of China. As a child, Wang was already reading physics and astronomy books; after years of diligence and education, he eventually ended up graduating from the University of Science and Technology of China with a Bachelor of Science in Astronomy. It was after graduation that Wang was faced with an intimidating yet exciting opportunity: a graduate school offer from the University of Florida, ten thousand miles away from home and across an entire ocean.

“It was a culture shock,” admitted Wang. “In China, English was only limited to the classroom. We didn’t really have anyone to practice speaking to.” And yet, despite the fact that this was his first time out of China, Ji not only successfully finished graduate school at the University of Florida with a PhD in Astronomy, but is now thriving as a postdoc at Yale University.

“Among all the courses I took, planetary science interested me the most,” says Wang. It was his deep interest in exoplanets that led to Wang’s involvement in SDSS-III. While he was a graduate student at the University of Florida, Wang initially became a part of the SDSS team by doing the labor-intensive work of cutting, polishing, and assembling fibers. His hard work paid off though, as he was eventually given the responsibility of calibrating and testing the MARVELS interferometer under Prof. Jian Ge. The result was a combination of an interferometer and spectrograph that is able to produce the same precision as a high resolution spectrograph by using less cost and a more compact instrument. The MARVELS instrument also has a multi-object capability; it can measure the radial velocities of 60 stars simultaneously, whereas most spectrographs used for planet searches can generally only look at one star at a time. “The optical path difference of the interferometer, usually referred to as the delay, needs to be very precisely determined,” explains Wang. “A precisely-measured delay is then used to calculate the radial velocity of the star.” The viability of the survey can be attributed in no small part to Wang’s careful calibration of the MARVELS instrument.

JiWang_MARVELS_fixed_delay_interferometer
The fixed delay interferometer for the MARVELS instrument. This interferometer is capable of interfering light from 60 fibers at the same time and provides a boost of sensitivity to Doppler shifts of a factor of 2. This picture shows the interference pattern of green mercury light in the lab. Each row represents the the light from a different fiber. (Image Credit: Xiaoke Wan)

Not only did Wang influence SDSS-III -– SDSS influenced Wang and other Chinese astronomers long before he came to the United States. “It’s resulted in many quality papers published by Chinese astronomers,” explained Wang. “Ten years ago, China was a lot less involved in international projects. SDSS has allowed China to get in touch with the latest astronomical data, creating a platform that has been a propelling force for Chinese astronomy.”

Now a postdoctoral associate at Yale University, Dr. Wang has recently led a paper that featured a planet discovered by citizen scientists working with data from the Kepler spacecraft as part of the Planet Hunters project, led by Prof. Debra Fischer.

Wang is a young astronomer, yet he has already made an integral contribution to a collaboration that has international influence. However, he believes that it is not only important to get people worldwide involved, but to get people from the general public involved as well, perhaps through projects such as Galaxy Zoo. “A lot of people are interested in space science and planet science. This is a good opportunity to present our results to the public and inspire others to get involved,” urged Wang. “It is our responsibility to invoke interest in astronomy and protect our field.”

Demonstrating the MaNGA Instrument at APO

MaNGA (Mapping Nearby Galaxies at APO) is one of the three surveys planned for the fourth generation of SDSS starting in 2014 http://www.sdss3.org/future/. The team has now successfully demonstrated instrumentation and observing procedures at Apache Point Observatory on the Sloan Foundation 2.5-m telescope.

The big technical challenge for the MaNGA instrument team has been to develop new bundle heads for the fibers which feed the BOSS spectrograph. These bundles enable many fibers to be places in a hexagonal grid across a galaxy:

MaNGA_galaxy_illustration

This will allow for resolved (or “integral field unit”; IFU) spectroscopy across the galaxy. The MaNGA survey will use these fiber bundles (which will vary in size from 19 to 127 fibers per bundle) to observe 10,000 nearby galaxies from 2014-2020.

Thanks to hard work from the instrument and data teams and support from the staff at APO and from SDSS-III, the MaNGA prototype IFU bundles have now successfully installed into an SDSS cartridge and used to obtain on-sky data along with to afternoon tests and calibrations.

Installation and First Light

MaNGA_ifu_bundle_installation
Nick MacDonald (UW) and Niv Drory (UNAM) led the installation of the MaNGA hardware, including the IFU bundles and 150 individual fibers, into the SDSS bright-time cartridge #1. With help from UW grad student Nell Byler and a few other helpful hands, the installation proceeded smoothly in about a day and a half.

MaNGA_plugging

MaNGA_plugging_1
Ting Xiao (SHAO) and Nell Byler (UW) inspected projected overlays on the first plate (top left) to determine which fibers and bundles should be plugged according to David Wake’s (Wisconsin) design. Veteran Sloan pluggers Francis Cope (APO) and Diana Holder (APO) then prepared the plate for the cartridge (top center) and plugged it (bottom and top right), providing valuable feedback about bending stresses in the fibers and the ease of plugging a complicated plate design.

MaNGA_v_grooves
Paul Harding (CWRU), Mike Blanton (NYU), and especially David Schlegel (LBNL) provided their expertise with remote support regarding cartridge layout, plate overlays, and the auto mapper that determines which fibers have been plugged into which holes. The fibers in each bundle are then spread out flat into “V grooves” (bottom right) where the light will be passed to the spectrograph to be spread out into its constituent wavelengths.

MaNGA_mounting
SDSS engineers Joe Huehnerhoff (UW) and Bob Pfaffenberger (APO) helped load the plugged MaNGA cartridge into the telescope for the first time. Behind the scenes, SDSS observer Kaike Pan drafted a series of scripts and tests that, thanks in part to quick off-site analysis by Renbin Yan, enabled the team to use the SDSS control software to carry out MaNGA observations. A day or two later, sunset at the 2.5 meter followed by First (Astronomical) Light for the MaNGA prototypes and a happy team at 4am local time.

MaNGA_slice_127_1comp

The highlight so far has been dithered observations of a plate designed to target stars and sample the PSF. MaNGA focused on several regions with 2-3 stars per bundle and MaNGA software pipeline developers David Law and Brian Cherinka (both U. of Toronto) have advanced the reduction pipeline to the point where they can produce preliminary 3D reconstructed data cubes from these observations! Here is an example of taken a 127-fiber bundle (top right) to observe a 25″x25″ region of the sky (SDSS image top center). Each fiber resulted in a spectrum . Integrating these spectra recovers the re-constructed image of these three stars as seen through the MaNGA IFU (top left).

SDSS-III at the American Astronomical Society meeting in Long Beach

The SDSS-III is at the 221st meeting of the American Astronomical Society. We have a number of talks and posters at this year’s meeting, including a special Thursday 10am morning session (Session 402, Room 102C) on the latest results from studying matter along the path to distant quasars.

LGB_Convention_Center

If you’re at the meeting please stop by and say hi. You could meet people like Jordan Raddick, SDSS-III education and public outreach and press officer; Peter Frinchaboy, key player in the APOGEE survey; or David Schlegel, principal investigator of the BOSS survey. They may not always be standing left-to-right as pictured below, but you can also learn about the latest results from APOGEE that they’re discussing displayed on the left.

AAS221_SDSS-III_booth_500

BOSS Survey and Plug Plate Featured in January 2013 National Geographic

The SDSS-III BOSS survey is highlighted in this month’s 125th anniversary issue of National Geographic. This news update features a dramatic image of one of the 1000-hole SDSS-III plates used to place the fiber optic cables. Each fiber optic cable carries the light of a target in the sky to the BOSS spectrograph where its light is split apart to identify the nature of distant galaxies and quasars and how much the Universe has expanded since that light was emitted.

ACT+BOSS Kinetic SZ Effect a Top 10 Breakthrough of 2012

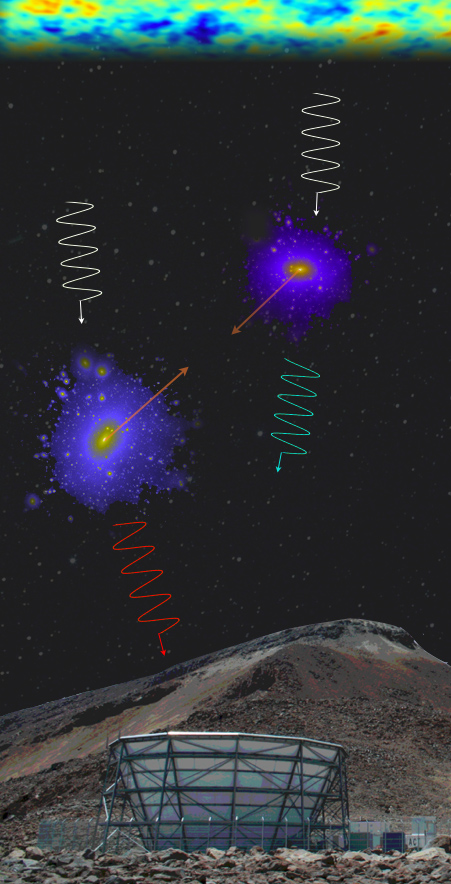
A paper published this year in Physical Review Letters (2012, 109, 041101), Evidence of Galaxy Cluster Motions with the Kinematic Sunyaev-Zel’dovich Effect, represented a joint collaboration between the Atacama Cosmology Telescope and the SDSS-III BOSS survey. This work presented the first detection of the kinetic Sunyaev-Zeldovich effect.

This paper has just been recognized by Physics World as one of the Top 10 Breakthroughs of 2012:

http://physicsworld.com/cws/article/news/2012/dec/14/physics-world-reveals-its-top-10-breakthroughs-for-2012