Colliding Stars May Spark Astronomical Fireworks

A key part of the impact of SDSS has been the use of data by scientists outside of the project itself. Recent results from the public data released last year as Data Release 8 find that there are enough merging white dwarfs in our galaxy to explain the observed rate of Type Ia supernovae.

In a paper accepted today to the Astrophysical Journal Letters, “The Merger Rate of Binary White Dwarfs in the Galactic Disk”, astronomers Carles Badenes (University of Pittsburgh) and Dan Maoz (Tel-Aviv University) used the individual sub-exposures from SDSS spectra to analyze spectra of white dwarfs at different times to statistically determine the number of binary white dwarf systems in our region of the Milky Way. They found that the number of binary white dwarf systems is enough to explain the one Type Ia supernova every 100 years that occurs in a galaxy like our own.

Doppler Shifted Spectrum of Binary White Dwarf System
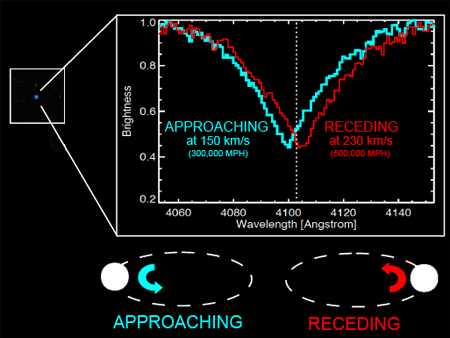
(Image Credit: Carles Badenes and the SDSS-III team)

Some ordinary-looking faint blue star (left) is actually a pair of white dwarfs, stars nearly as massive as our sun but compressed by gravity to a density that is a million times higher. The analysis of SDSS data by Badenes and his team shows that white dwarf pairs are common enough that their collisions, induced by the emission of gravitational waves, can explain the important class of cosmic explosions known as “Type Ia supernovae.”

An SDSS spectrum usually detects light from just the brighter of the two white dwarfs. But we can learn of the presence of the fainter companion, and the future of both stars, from measuring multiple spectra of the star we can see. As the white dwarf orbits its unseen companion, it sometimes approaches us (blue in the drawing at the bottom) and sometimes recedes from us (red).

For more details see the SDSS-III press release
http://www.sdss3.org/press/20120227.fireworks.php
or the write-up in Ars Technica.

There is also a companion paper that gives more of the in-depth technical details:
“Characterizing the Galactic White Dwarf Binary Population with Sparsely Sampled Radial Velocity Data”
Dan Maoz, Carles Badenes, Steven J. Bickerton
http://arxiv.org/abs/1202.5467

Back to the Future: Cosmic distance measurements just got better!

Driven by a mysterious dark energy, the expansion of the Universe is accelerating. This increased rate of expansion is one of the most puzzling issues in astronomy in the last two decades. The most promising way to understand the nature of dark energy is to measure the expansion history of the Universe by determining distances to when the Universe was younger. To measure these distances, the Universe provides us with a cosmic yardstick, 500 million light years long, known as baryon acoustic oscillations (BAO). These are sound waves formed in the very early Universe, whose wavelength has been imprinted in the distribution of galaxies. By measuring the BAO on the sky at various cosmic epochs we are measuring the distance to those epochs and therefore mapping the expansion history of the Universe.

The SDSS survey used a sample of luminous red galaxies to detect for the first time the presence of the BAO and measure its angular extent on the sky. The specific size of the BAO is imprinted in the separation of the overdense regions of the Universe in Figure 1. As the Universe evolves with time, these overdense regions will form galaxies. However, the positions of the galaxies are distorted by gravitational interactions between the large overdensities over time as shown in Figure 2. In order to accurately measure the BAO extent at different epochs, we would need to measure the undistorted positions of the galaxies, washed away by gravity.


In a recent series of three papers, a team of SDSS astronomers has applied for the first time a novel technique to estimate the displacement of each galaxy due to gravitational effects, shown as blue arrows in Figure 3. Subtracting these displacements effectively moves the galaxies back in time, thereby undoing a majority of the gravitational distortions and reconstructing the original matter distribution in Figure 4. This reconstruction technique sharpens the focus on our standard ruler and increases the precision of cosmic distance measurements. These results will pave the way for even more precise measurements from the Baryon Oscillation Spectroscopic Survey.


More details can be found at:
http://www.astro.yale.edu/padmanabhan/dr7recon/

The three papers submitted to Monthly Notices of the Royal Astronomical Society are available at:

http://arxiv.org/abs/1202.0090 (Padmanabhan et al. 2012 – Methods and application to SDSS)
http://arxiv.org/abs/1202.0091 (Xu et al. 2012 – Fitting techniques)
http://arxiv.org/abs/1202.0092 (Mehta et al. 2012 – Cosmological measurements and interpretation)

BOSS Survey Reaches 50% Complete with 860,000 galaxies, quasars, and stars

The SDSS-III BOSS survey is now 50% complete. BOSS Survey Scientist Kyle Dawson and Principal Investigator David Schlegel report that as of January 31, 2012 BOSS has completed 1106 survey-quality plates out of its target goal of 2212 plates by summer 2014. Each plate contains holes matching 1000 targets on the sky. 64% of these targets are galaxies, 11% are quasars, 11% are stars, 10% of these targets are observations of blank sky used for calibration, while 3% were targeted as galaxies, quasars, or stars but we didn’t get sufficient signal to classify them. Completing 1106 plates means that BOSS now has collected spectra of 860,000 astrophysical objects including:

642,000 galaxies
110,000 quasars
108,000 stars
  30,000 objects without secure classifications

This puts BOSS slightly ahead of schedule, largely thanks to the very hard work of the entire observing team, and a bit of luck from some slightly darker skies associated with solar minimum.

A noticeable part of the brightness of the night sky emission comes from emission high in the Earth’s atmosphere that is excited by extreme-ultraviolet (EUV) emission from the Sun. The strength of the solar EUV emission follows with the general solar cycle. Thus the sky brightness of the Earth’s atmosphere shows similar variations, which can be as much as 50% of the sky brightness at a dark site.

But closer to cities, the sky brightness is completely dominated by the glow from city lights, which is why the stars of the Milky Way aren’t visible to most people living in the developed and urbanized world. Increasing light pollution from cities is one of the reasons astronomers are forced to place observatories in increasingly remote locations.

BOSS Imaging Cosmology Results at AAS

Thousands of astronomers are gathered in Austin, Texas this week for their annual winter meeting in the US. At a special session held this afternoon, SDSS-III scientists presented cosmological results from BOSS imaging data and provided hints of the power of the spectroscopic data to come in a few months.

BOSS Imaging Cosmology Press Release

David Kirkby (UC Irvine) provided a nice visualization of the 900,000 galaxies that were used to measure structure in the Universe to teach us more about the nature of dark matter, dark energy, and neutrinos in the Universe:


AAS Joint SEGUE-2 and APOGEE Press Conference

Today at the 219th meeting of the American Astronomical Society, SDSS-III astronomers presented new evidence probing the history of the disk of our galaxy from SEGUE-2 and the first peak at science from impressive new APOGEE instrument.

For more details see the press releases at:

SEGUE-2 Press Release

APOGEE Press Release

which include the following figures highlighting the results:


APOGEE:
The agove figure shows the “first-light” field of stars observed by APOGEE. This field is filled with Milky Way stars, star clusters and dust (seen as colored, glowing clouds in this image from NASA’s WISE infrared observatory). The large white circle is the field of view of APOGEE, with a width spanning six moon diameters. The green circles indicate known or suspected young star clusters. The small red circles indicate the position of each faint star targeted with APOGEE’s fiber optic system. The inset shows pieces of the APOGEE spectra for stars determined by APOGEE to be members of two of the clusters shown. These members were identified by the near identical motions through the galaxy shared by each clusters’ stars. The motions are detected as shifts of the spectral features caused by the Doppler effect. These dark line features are caused by absorption of specific colors of light by the atoms of the different chemical elements in each star. Figure Credit: P. Frinchaboy (Texas Christian University), J. Holtzman (New Mexico State University), M. Skrutskie (University of Virginia), G. Zasowski (University of Virginia), NASA, JPL-Caltech and the WISE Team.


SEGUE-2:


The above figure highlights the measurements of the metal content of stars in the disk of our Galaxy, using stars observed by SDSS-III’s SEGUE-2 survey. Horizontal lines describe where SEGUE data measure the chemical composition of stars near and above the plane of the disk. The bottom panel shows the decrease in metal content as the distance from the Galactic center increases for stars near the plane of the Milky Way disk. In contrast, the metal content for stars far above the plane, shown in the upper panel, is nearly constant at all distances from the center of the Galaxy. The image of the Milky Way is from the Two-Micron All Sky Survey. Figure Credit: Judy Cheng and Connie Rockosi (University of California, Santa Cruz) and the 2MASS Survey.

SDSS-III finds a large population of massive galaxies making stars 5 billion years ago

Building on the legacy of the Sloan Digital Sky Survey (SDSS), the SDSS-III’s Baryon Oscillation Spectroscopic Survey (BOSS) is currently mapping the spatial distribution of the most massive galaxies in the Universe. SDSS-III astronomers have been using the galaxy spectra obtained by these experiments to infer important physical information about the stars and the gas in these systems, which illuminate how galaxies formed and evolved over the history of the Universe.

In a recent paper, BOSS scientists from the University of Wisconsin, the Max Planck Institute for Astrophysics, Johns Hopkins University, along with other members of the SDSS-III team, studied the masses and ages of around 300,000 massive galaxies at redshifts ranging from 0.45 to 0.7, corresponding to a time when the Universe was 60 percent of its present age of 13.7 billion years. These galaxies all have stellar masses larger than 100 billion times that mass of our Sun (10^11 Msun), making this the largest sample of massive galaxies with spectra to have been analyzed thus far.

“Evolution of the Most Massive Galaxies to z=0.6: I. A New Method for Physical Parameter Estimation”
Yan-Mei Chen et al.
http://arxiv.org/abs/1108.4719

The above figure from the paper shows the fraction of galaxies with recent star formation as a function of galaxy mass. The solid red,black and blue lines show the fraction of galaxies that have formed more than 5, 10, and 15% of their stars in the last billion years as a function of stellar mass. These results are for galaxies with median redshift z=0.1 in the SDSS low-redshift MAIN sample. The dashed red,black and blue lines show the same thing for galaxies with median redshift z=0.5 in the BOSS sample. Note the flattening and potential increase in the star formation rate for the most massive galaxies at z=0.5.

Massive galaxies are thought to represent the end-point of galaxy evolution. Small galaxies form first and then merge to create larger galaxies. Each merger should trigger a burst of star formation. At the present day the most massive galaxies we see around us are no longer forming new stars, which has been somewhat surprising because there are still galaxies merging today. But by looking back 5 billion years, BOSS astronomers were able to see massive galaxies still assembling and forming new stars.

This suppression of star formation in massive galaxies seen at the present day has been postulated to be due to several different exotic mechanisms that heat the gas and prevent it from forming stars. Examples range from giant explosions powered by material accreting onto central black holes of a billion or more solar masses, to megaparsec-scale jets of charged particles traveling at relativistic speeds, which penetrate and heat the gas surrounding the galaxies. The new results from SDSS-III indicate that these exotic mechanisms may have a much harder time stopping star formation in massive galaxies at higher redshifts.

The new technique and the unprecedentedly large galaxy sample, allowed the team to conclude that the fraction of the most massive galaxies with young stars has decreased by a factor of 10 over the last 4 billion years (see Figure) of the 13.7-billion year lifetime of the Universe. At redshift 0.5 (8-9 billion years after the Big Bang), more than 10% of all galaxies with stellar masses of around 200 billion solar masses have experienced a significant recent episode of star formation. These results are at odds with previous claims that the stars in massive galaxies all formed only 2-3 billion years after the Big Bang. The results are also exciting, because next generation X-ray satellites will be able to detect the gas as it cools and forms stars in these massive galaxies and next generation radio surveys will track how energetic particles propelled by black holes deposit their energy into this gas. Current speculation about exotic mechanisms will then be transformed into hard science.


Written by Guinevere Kauffmann
Edited by Michael Wood-Vasey

The paper submitted to Monthly Notices of the Royal Astronomical Society is available at:
http://arxiv.org/abs/1108.4719
And more details can be found at:
http://www.mpa-garching.mpg.de/mpa/research/current_research/hl2012-1/hl2012-1-en.html

Multiple Tidal Tails from the Sagittarius Dwarf Galaxy Wrap Around the Sky

The Milky Way galaxy continues to devour its small neighboring dwarf galaxies and the evidence is spread out across the sky.

A team of SDSS-III astronomers led by Sergey Koposov and Vasily Belokurov of the University of Cambridge recently discovered two streams of stars in the Southern Galactic hemisphere that were torn off the Sagittarius dwarf galaxy. This discovery came from analyzing data from the latest Data Release 8 from SDSS-III and was announced in a paper just released as (arXiv paper #1111.7042) that connects these new streams with two previously known streams in the Northern Galactic hemisphere. There is evidence that the brighter stream boasts stars with more heavy elements such as iron, while the fainter stream appears to be older.

(Image Credit: Sergey Koposov) The image above shows a map of the sky showing the numbers of stars counted in the Sagittarius streams. The colors indicate the distances to the stars identified in the study – stars located in red areas are further away, while stars in the blue areas are closer. The dotted red lines trace out the Sagittarius streams, and the blue ellipses in the center show the current location of the Sagittarius Dwarf Galaxy.

(Image Credit: Amanda Smith) The artist’s illustration above shows the four tails of the Sagittarius Dwarf Galaxy (the red-orange clump on the left of the image) orbiting the Milky Way. The bright yellow circle to the right of the galaxy’s center represents our Sun (not to scale). The Sagittarius dwarf galaxy is on the other side of the galaxy from us, but we can see its tidal tails of stars (white in this image) stretching across the sky as they wrap around our galaxy.

For more details see the full press release at http://www.sdss3.org/press/20111130.fourtails.php

BOSS Reaches Observing Milestone: 500,000 galaxies + 100,000 quasars

The SDSS-III Baryon Oscillation Spectroscopic Survey (BOSS) has just passed the milestone of observing 500,000 galaxies and 100,000 quasars. By the completion of the survey in 2014, BOSS will have observed 1.5 million galaxies and 250,000 quasars as it maps out the distribution of matter in the Universe and measures the properties of dark energy.

The first image, courtesy of Kyle Dawson (Utah), shows the BOSS coverage on the sky (right ascension and declination) of the current survey (red). The planned total coverage is shown in grey, and we’ve already drilled the plates for all of the tiles in blue.

The second image, courtesy of Michael Blanton (NYU), shows the redshift and right ascension coverage of the BOSS survey to date. While there are many more galaxies in the Universe beyond a redshift of 0.7, BOSS is focusing on galaxies between now and 6.5 billion years ago (redshift of 0.7, shown in white) when dark energy was just starting to have a noticeable effect. The red and yellow dots are the galaxies from the previous SDSS I/II surveys and show by contrast how much more of the Universe SDSS-III BOSS is exploring. The BOSS quasars, shown in cyan, probe the Universe out to 11.5 billion years ago to study the formation of black holes in the early Universe while also using their powerful light to explore the intervening material between those distant quasars and us. BOSS is aiming to obtain quasars between redshifts of 2 and 3 but is also taking repeat observations of lower-redshift quasars from SDSS I/II to study variability of these mysterious objects powered by massive black holes at the centers of galaxies.

SDSS3 Quasars at Princeton

Last week (Nov 3-5) 45 astronomers from the SDSS-III BOSS collaboration met at Princeton University to talk about the latest results from observing quasars. These extraordinarily luminous objects are powered by black holes feeding on gas in distant galaxies. Quasars are helping to tell us about the formation of galaxies in the early Universe and how the elements formed in stars are distributed in and around galaxies up to the present day.

The astronomers kindly paused in their contemplations to pose for the group picture above (photo credit: Keren Fedida).

SDSS One of Ten Most Amazing Databases

Popular Science Magazine picks SDSS as one of the world’s ten “most amazing” databases:

http://www.popsci.com/technology/article/2011-10/amazing-databases-sloan-digital-sky-survey-database

and shows how much our view of the Universe has changed in the last 60 years due to the data from SDSS and other large-scale astronomical surveys:

http://www.popsci.com/content/visible-universe-then-and-now

APOGEE Begins its Survey of Stars and their Formation of the Elements in the Milky Way

The Discovery Channel’s Daily Planet followed the APOGEE team as they installed the APOGEE camera on the SDSS telescope and first used the system to detect light from stars in the Milky Way. The very first spectroscopic images clearly reveal the different elements that make up these stars and start telling the story of how generations of stars in our galaxy created the elements that make our Solar System and life itself possible.

http://watch.discoverychannel.ca/#clip525876

Some impressive (round) numbers

Michael Strauss (Princeton) just reported some really impressive statistics for SDSS. There are now over 4000 refereed papers with “SDSS” or “Sloan Survey” in their abstract or title.

To astronomical accuracy, that’s about one paper per day since the telescope saw first light in 1998 . These papers have been cited over 150,000 times (154,997, to be precise). The York et al. (2000) technical paper describing the SDSS has over 3000 citations itself.

The h-index of the survey is 159: that is, there are 159 papers with 159 or more citations (and 316 papers with more than 100 citations). The g-index is 288; i.e., the average number of citations of the 288 most cited papers is 288. Thus far in 2011, there are 486 papers published, and the year is not even complete.

To compare with some other major facilities:

* IRAS (launched in 1983) has 5822 papers, 187,377 citations, and h=158

* WMAP (launched in 2001) has 1855 papers, 93,097 citations, and h=123

* HST (launched in 1990) has 9460 papers, 329,920 citations, and h=190

Here is the ADS query that were used for the SDSS statistics

These queries are not exact; there are no doubt important papers that are missed, and some other papers that are included that are not really proper matches; for example, one of the most highly cited “SDSS” papers is the Becker et al. (1995) paper, describing the FIRST survey, which only makes reference to the SDSS footprint on the sky.

SDSS keeps getting bigger

Daniel Eisenstein (SDSS-III Director) just reported that the SDSS-III collaboration has over 600 active scientists involved in accessing and analysing SDSS data (as counted by their wiki-page accounts). These scientists come from the 50 worldwide institutions now involved in SDSS-III, as well as approved external participants, collaborators and contractors. This proves that the SDSS-III is one of the largest collaborations in Astronomy.

Movie of Lyman-alpha Forest

A new movie created by David Kirkby (UC Irvine) shows the three-dimensional distribution of the Lyman-alpha “forest” (in blue) that appears in front of each of the 70,000 high-redshift quasars (yellow) in the preliminary BOSS DR9 sample. Only that portion of the forest where Lyman-alpha absorption is visible to the BOSS spectrograph is shown. Transparent spheres at redshifts of 2, 3 and 4 set the radial scale. Some of the gaps in the DR9 coverage will be filled in over the final years of the BOSS survey. The DR9 Lyman-alpha sample consists of about 32 million “pixels” of co-added spectral data, and almost 100 billion pixel pairs with 3D separations less than 200 Megaparsecs. The large volume sampled in DR9 offers an unprecedented map of the cosmological distribution of matter during an important earlier epoch in the interplay between dark matter and dark energy.

We show a frame of the movie here but you can get the movie at http://darkmatter.ps.uci.edu/lya-dr9/