How SDSS Uses Light to Find Rocks in Space

It’s an exciting time in solar system exploration, with the Philae lander and Rosetta orbiter exploring Comet 67P Churyumov-Gerasimenko, sending back our most details view ever of a comet. On top of this the New Horizons Mission is approaching the dwarf planet Pluto, and will make its closest pass on 15th July 2015, sending back the highest resolution images of Pluto we have ever seen.

You might think that the Sloan Digital Sky Survey has nothing to say about rocks in space, but you’d be wrong. One of the possibly unexpected discoveries from our  imaging survey has been that of many hundreds of thousands of asteroids.

Because of the way the SDSS Camera Worked, asteroids show up in the SDSS imaging at different times (and therefore different places as they are moving across the sky) in the different filters. This makes them pop out as little strings of almost traffic light coloured dots. These have been popular finds by citizen scientists at Galaxy Zoo as well as identified by computer algorithms.

Asteroids (the three coloured dots) found near galaxies by citizen scientists at Galaxy Zoo.

Asteroids (the three coloured dots) found near galaxies by citizen scientists at Galaxy Zoo.

The below animation by Alex Parker shows the orbital motions of over 100,000 of the asteroids observed by the Sloan Digital Sky Survey (SDSS), with colors illustrating the compositional diversity measured by the SDSS five-color camera. The relative sizes of each asteroid are also illustrated.


All main-belt asteroids and Trojan asteroids with orbits known to high precision are shown. The animation has a timestep of 3 days. The fact that the composition of asteroids in the asteroid belt varys systematically is clearly visible, with green Vesta-family members in the inner belt fading through the blue C-class asteroids in the outer belt, and the deep red Trojan swarms beyond that.

Occasional diagonal slashes that appear in the animation are the SDSS survey beams.

The average orbital distances of Mercury, Venus, Earth, Mars, and Jupiter are illustrated with rings.

Colors represented with the same scheme as Parker et al. (2008). Concept and rendering by Alex H. Parker. Music: Tamxr by LJ Kruzer.


This post is part of the SDSS Celebration of the International Year of Light 2015, in which we aim to post an article a month about how SDSS uses light in our mission to study the Universe. We’ve reached the halfway point here in June 2015! 

How SDSS Used Light to Make the Largest Ever Image of the Night Sky

The Sloan Digital Sky Survey imaged over 30% of the sky between the years of 1998-2008, creating the largest digital colour image of the sky ever taken. To view all of the SDSS imaging at once, would require 500,000 HD televisions (so it can be displayed at full resolution), and with more than a trillion pixels, this image dwarfs the 1.5 billion pixel image that NASA recently claimed was the biggest ever taken.

The SDSS Camera which took all of this imaging is now retired, and was collected by the Smithsonian Institution, to be packed away in a basement as an “artifact of scientific significance”.

The SDSS Camera in its current home - a basement of the Smithsonian Museum in Washington, D.C. Image Credit: Xavier Poultney, SDSS.

The SDSS Camera in its current home – a basement of the Smithsonian Museum in Washington, D.C. Image Credit: Xavier Poultney, SDSS.

The SDSS camera was made by arranging together an array of thirty, 2048×2048 pixel CCD chips. In the 1990s this was state-of-the-art, and even today a 126 Megapixel camera is nothing to sniff at (e.g the current state-of-the-art is DECam which has 62 CCDs and a total of 520 Megapixels).

The CCD chips in the SDSS camera were aligned in five columns, each covered by one of the five filters used to make the colour imaging (the u-, g-, r-, i- and z-bands, roughly corresponding to collecting light in the near-ultraviolet, green, red, near-infrared and a bit less near-infrared respectively).

faceplat2

An illustration of the arrangement of the CCDs and filters on the camera. The filters from top to bottom are r, i, u, z and g-band. Image credit: SDSS.

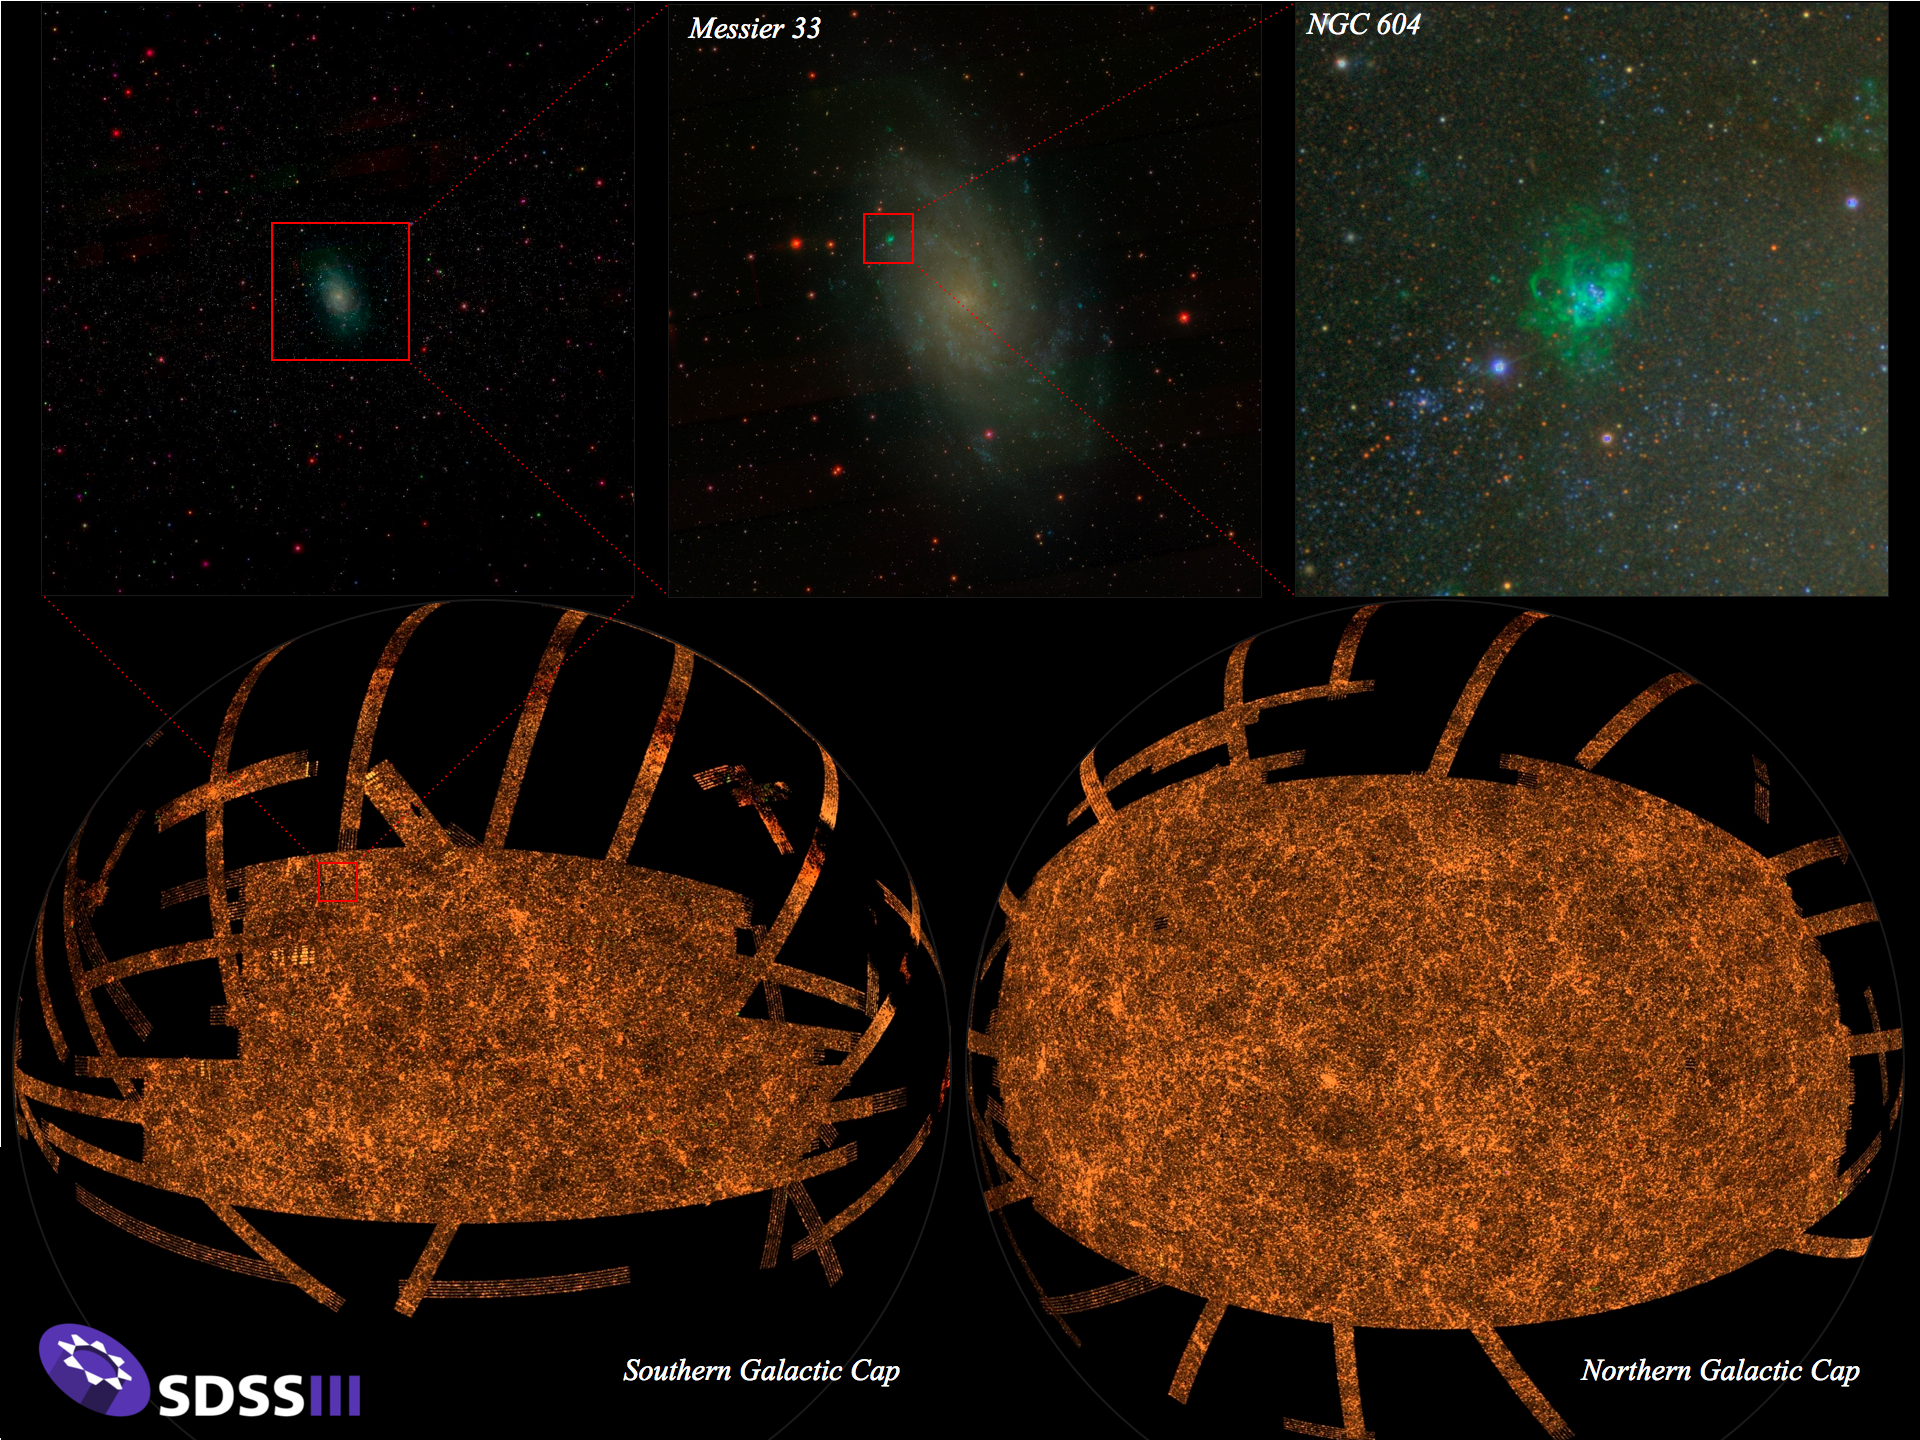
This arrangement meant that the camera could take images continuously as the Earth rotated and moved it with respect to the sky overhead. SDSS images are therefore arranged in long stripes of constant Declination across the sky (the most famous being “Stripe 82” which was imaged many times). You can make out some of these stripes around the edges of the stitched together image (the “legs of the orange spider” below).

Orange Spider! This illustration shows the SDSS imaging on many scales. The picture in the top left shows the SDSS view of a small part of the sky, centered on the galaxy Messier 33 (M33). The middle and right top pictures are further zoom-ins on M33. The figure at the bottom is a map of the whole sky derived from the SDSS image. Visible in the map are the clusters and walls of galaxies that are the largest structures in the entire universe. Figure credit: M. Blanton and SDSS

All SDSS imaging is publicly available and can be explored online via the SDSS Skyserver. The Navigate Tool is especially fun as you can scroll around the entire image.

A much more technical description of the camera can be found in Gunn et al. (1998) and in the SDSS-I project book.


This post is part of the SDSS Celebration of the International Year of Light 2015, in which we aim to post an article a month about how SDSS uses light in our mission to study the Universe.