Some of the most beautiful pictures taken by telescopes are those of galaxies. Containing billions of stars, they come in many shapes and sizes. We can study the stellar structures in galaxies from telescope images to learn more about the ways that galaxies form and evolve. We also can look at gas and dust features in galaxies, and the role that these play in the formation of new stars.

Elliptical galaxy NGC 4636 (left) and spiral galaxy M81 (right), as seen by the Sloan Telescope. The telescope captures the light of the stars, and in M81 we can also see some dust in the spiral arms. Both galaxies reside in large, invisible, dark matter haloes.
Yet, the largest and most massive component of a galaxy, the dark matter halo, is truly invisible. Dark matter is not made out of ‘normal material’ or baryons, which are the building blocks of stars, planets and all other matter surrounding us. Instead, dark matter is thought to be an exotic particle that does not emit or absorb any light: it does not interact with the electromagnetic force like normal matter. So how do we then know that the dark matter is there?
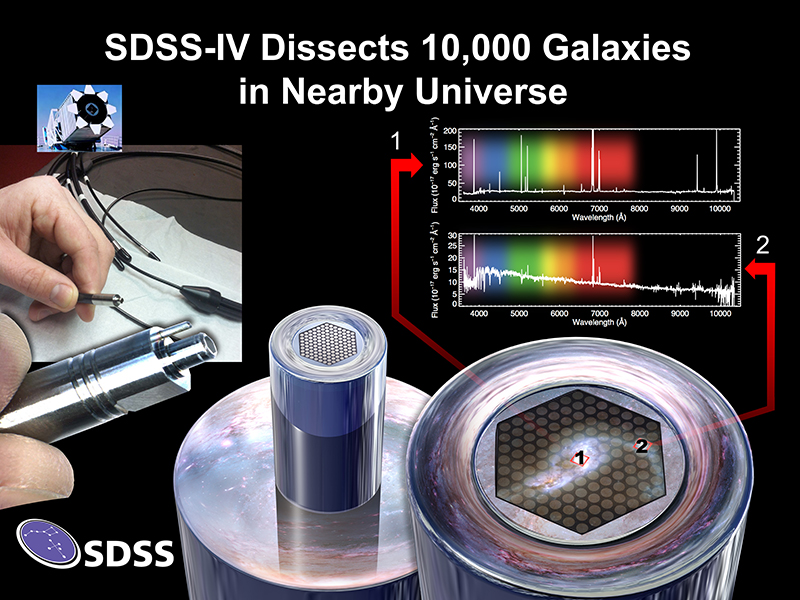
The answer lies in the light that we observe from the stars and the gas in galaxies. With images we capture the presence of light, but with spectrographs we unravel the light into different colours or wavelengths. The resulting galaxy spectra show us how the stars are moving around in the galaxy. In most galaxies, the stars will rotate around the centre of the galaxy, and this rotational velocity can be seen in the spectrum by a shift in the stellar absorption lines. This shift results from the Doppler Effect, which causes the lines of stars that move away from us to shift towards the red part of the spectrum, while the lines of stars that are moving towards us shift to the blue part of the spectrum. This way, we can find out how fast the stars in a galaxy are rotating around the galaxy centre. But there is more information in the spectrum: the lines are not infinitely thin, but are slightly broadened. This broadening is called ‘velocity dispersion’ and is caused by the additional random motions of the stars. With the new Sloan Survey, MaNGA, we are measuring the rotational and random motions of the stars in 10,000 galaxies. And because MaNGA is an integral-field spectrograph, we can map these motions not only in the very centre of the galaxies, but also in their outskirts, as shown below.

MaNGA is an integral-field spectrograph, capturing spectra at multiple points in the same galaxy with a fiber bundle. The bottom right illustrates how each fiber will observe a different section of the galaxy. The top right shows data gathered by two fibers observing two different part of the galaxy, showing how the spectrum of the central regions differs dramatically from outer regions. From these spectra, we measure the rotational and random motions of stars, to deduce how much dark matter is present in the galaxy. Image Credit: Dana Berry / SkyWorks Digital Inc., David Law, and the SDSS collaboration
How do these velocity and dispersion maps help us to find the dark matter? The answer is gravity. The stars are moving around in a galaxy under the influence of gravity: the more matter (mass) there is in the galaxy, the faster the stars are moving. Now that we have measured the movements of the stars in the galaxies, we can deduce how much matter is needed to have the stars move around with those measured velocities. And we can compare that gravitational mass with the luminous mass in the galaxy (the stars, gas and dust). For all galaxies studied so far, the gravitational mass is much larger than the luminous mass: hence the need for dark matter.

Example of a galaxy observed with MaNGA. Left is the image of the galaxy, showing the stellar light. The middle image is the rotational velocity field of the galaxy: the red part of the galaxy is moving away from us with 254 km/s, and the blue part of the galaxy is moving towards us with the same velocity. The green axis down the middle is the rotation axis. The right image shows the random motions of the stars: these are higher in the centre (red: 257 km/s) than in the outskirts of the galaxy (blue: 94 km/s). Figure taken from Bundy et al. 2015.
Sophisticated mass or dynamical models of the galaxies, based on the observed velocity and dispersion maps, tell us how the luminous and dark matter are distributed in the galaxy, and what the properties (mass, size, concentration) of the dark haloes are. Comparing these mass models with predictions from galaxy formation theories will help us forward in our quest to understand galaxies, and the dark haloes that surround them. But it all starts with capturing the stellar light of galaxies in spectrographs, to map the invisible.
This post was written by Dr. Anne-Marie Weijmans (St Andrews) and is part of the SDSS Celebration of the International Year of Light 2015, in which we aim to post an article a month about how SDSS uses light in our mission to study the Universe.